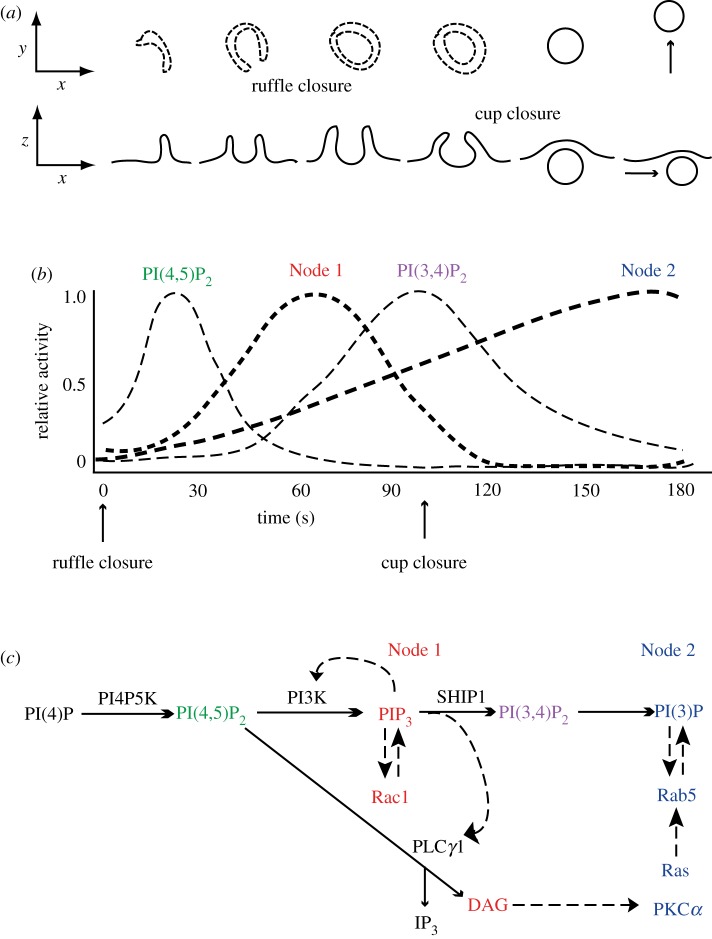
Figure 3.
Signal cascades within circular ruffles and macropinosomes. (a) Diagram of the stages of macropinosome formation. The top row shows a side view and the bottom row shows a top view (as observed in the microscope) of plasma membrane and macropinosome membranes. Ruffle closure is the formation of a complete circular ruffle, comprised entirely of plasma membrane. Cup closure occurs when the macropinosome separates from the plasma membrane. (b) The timing of signals in cups relative to ruffle closure and cup closure. The sequence of chemical transformations occurring between ruffle closure and cup closure begins with a transient increase in PI(4,5)P2, followed by increases of PIP3, DAG and the activity of Rac1 (Node 1), and later by a transient increase of PI(3,4)P2. Within Node 1, the increase in DAG follows shortly after the PIP3 spike [34]. The levels of PI(3)P and the activities of Ras, Rab5 and PKCα (Node 2) increase continuously in the cup, peaking after cup closure and the transient increases of PI(4,5)P2, PIP3, DAG and PI(3,4)P2. (c) Proposed sequence of chemical changes in cups and macropinosomes. Solid lines with small arrowheads indicate precursor–product relationships. Hatched lines with large arrowheads indicate activation pathways enhanced inside circular ruffles. Red font indicates signals comprising Node 1; blue font indicates signals comprising Node 2. Adapted from Yoshida et al. and Welliver et al. [34,43].

