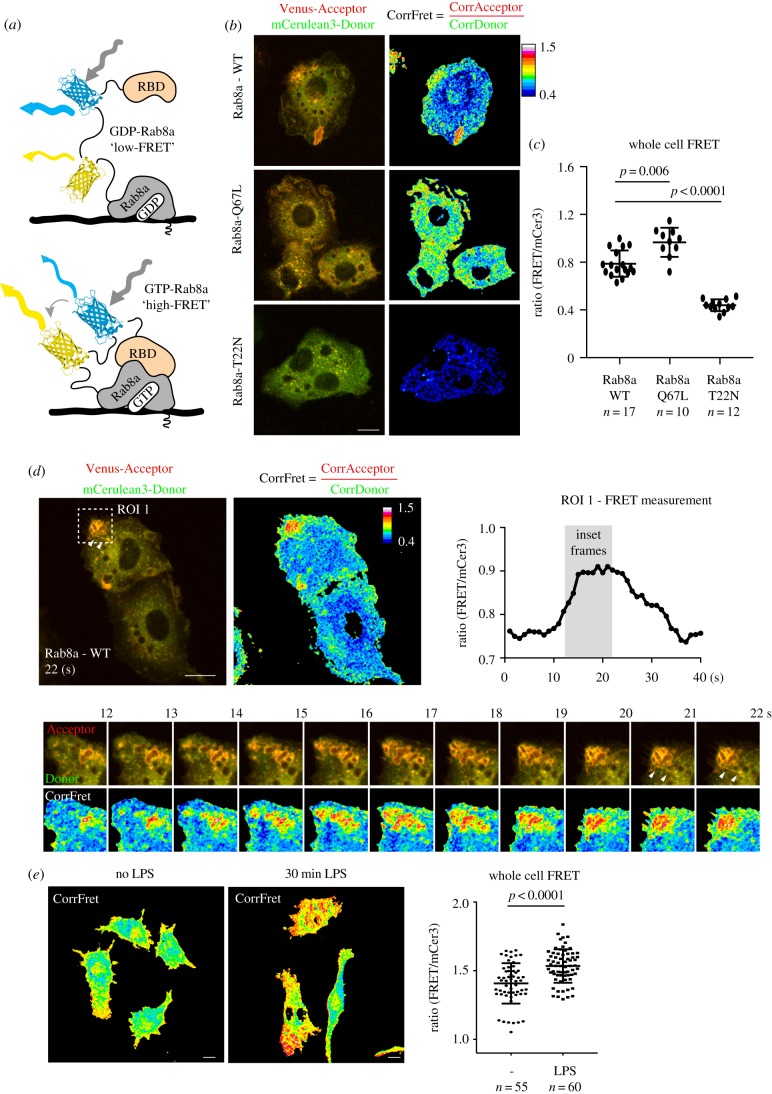
Figure 5.
Rab8a biosensor reveals enhanced Rab8a activity on macropinosomes and tubules. (a) Schematic diagram illustrating the architecture of the Rab8a biosensor. High-FRET is observed on membrane domains where GTP-Rab8a recruits the MICAL-L2 Rab-binding domain at the extreme C-terminus of the biosensor. (b,c) Whole cell FRET measurements of Rab8a WT-, Q67L- and T22N-expressing RAW 264.7 macrophages. The mCer3 ‘donor’ channel is pseudo coloured green and the Venus ‘acceptor’ channel is pseudo coloured red for visualization. (d) Live-cell imaging and quantification of the Rab8a WT biosensor. Region of Interest 1 (ROI 1) is boxed and measurements were taken every second over 48 s. Inset frames represent the rise from low to high FRET measurements. (e) Whole cell FRET measurements of cells left untreated or treated with 10 ng ml−1 LPS. Cells were imaged using the Zeiss Axiovert 200 spinning disk microscope with a 60× objective for (b–d) and 40× for (e). Data represented as mean ± s.d. Scale bar, 10 µm.

