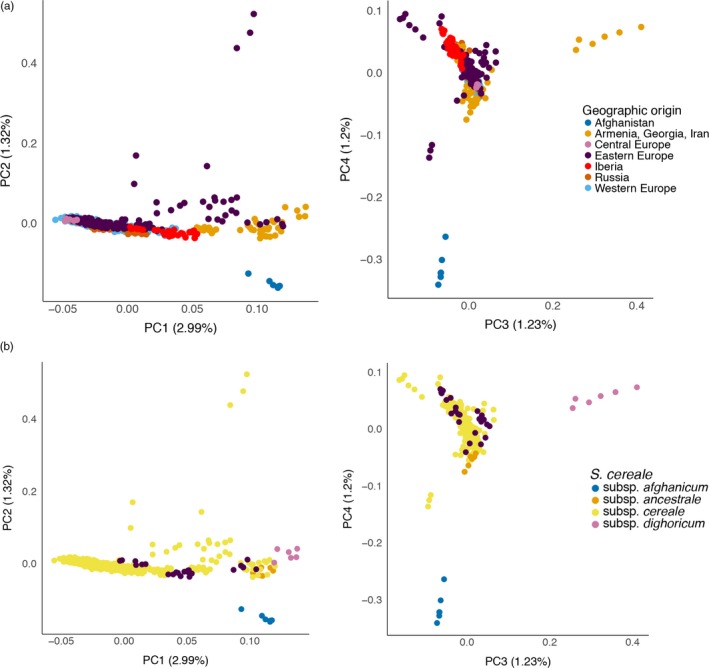
Figure 4.

Principal component analysis across S. cereale samples, excluding subspecies vavilovii. The top (a) and bottom (b) panels show the same data using different color and symbol (as indicated in the legends) to show geographic and taxonomic patterns. The left panels plot principal component 1 (PC1) against PC2; the rights panels show PC3 versus PC4. The proportion of variance explained by each PC is indicated in parentheses in the axis labels
