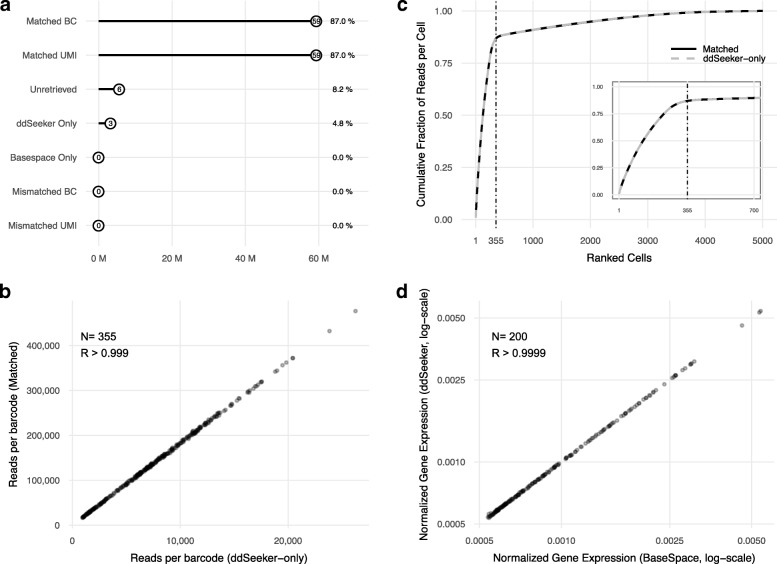
Fig. 2.
Application of ddSeeker to Illumina test dataset a Dot plot reporting the number of reads for which ddSeeker and BaseSpace identify the same barcode and UMI (Matched BC and UMI), ddSeeker and BaseSpace do not identify valid barcode and/or UMI (unretrieved), only ddSeeker or BaseSpace were able to identify barcode and UMI (ddSeeker- and BaseSpace- only) and the number of reads identified with different barcode and/or UMI by the two tools (Mismatched BC and UMI). b Cumulative fraction of reads per cell in the 5,000 most read barcodes for matched BC reads (solid black line) and ddSeeker-only reads (dashed grey line). Vertical line corresponds to the number of valid cells based on the knee analysis from the Illumina BaseSpace report (n=355). c Scatter plot of the number of reads with matched BC versus the number of ddSeeker-only reads for the 355 valid cells. R is the Pearson’s correlation coefficient. d Scatter plot of the averaged normalized expression across the 100 most read cells of the 200 most expressed human genes following ddSeeker (y-axis) versus BaseSpace (x-axis) pipelines

