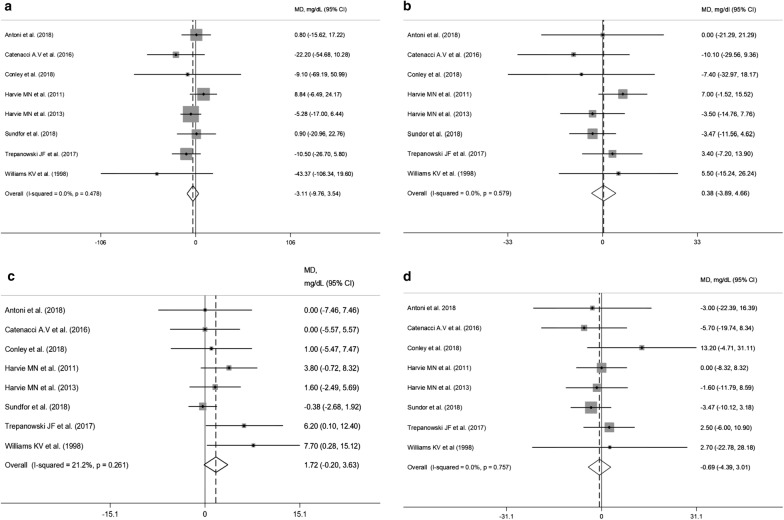
Fig. 4.
Meta-analysis of the effects of intermittent energy restriction versus continuous energy restriction on triglycerides (a), total cholesterol (b), HDL-cholesterol (c) and LDL-cholesterol (d) values. MD (mean difference) indicates the mean difference on change from baseline of the IER vs. the CER arms. The plotted points are the mean differences and the horizontal error bars represent the 95% confidence intervals. The grey areas are proportional to the weight of each study in the random-effects meta-analysis. The vertical dashed line represents the pooled point estimate of the mean difference. The solid black line indicates the null hypothesis (MD = 0)

