Fig. 1.
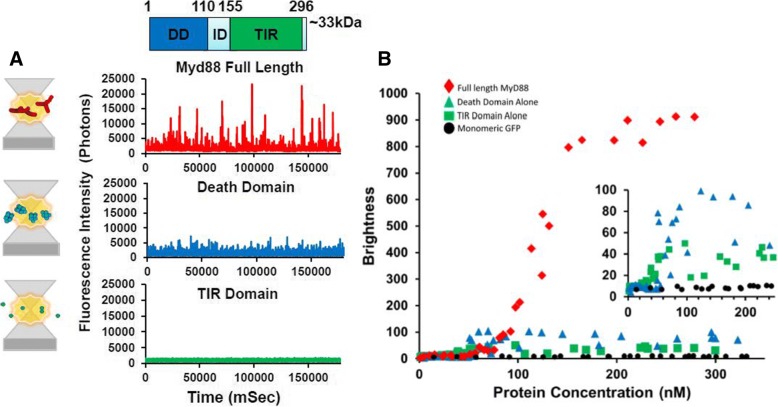
The domains of MyD88 exhibit different oligomerisation propensities, with only the full-length protein forming polymers. a Schematic diagram of single-molecule counting experiments, demonstrating the distinction between the oligomeric protein sizes measured, as the green fluorescently tagged protein complexes excited by a 488-nm laser diffuse freely in and out of the focal volume. The schematic diagrams reflect the fluorescence time-traces obtained. The diffusion of an oligomer equates to the same number of fluorophores moving through the confocal volume, creating a burst of fluorescence in the time-trace being directly proportional to the size of the oligomer. For GFP-tagged MyD88 TIR domain, small fluctuations in intensity are recorded around the average fluorescence value, as expected for a low-order oligomer such as a dimer (for example, if 20 proteins are detected simultaneously, the exit/entry of a single protein causes a decrease/increase of signal of only 5%). The GFP-tagged MyD88 DD shows larger bursts of fluorescence correlating with these death domains forming higher order oligomeric complexes. As seen by the fluorescent time traces, N-terminally GFP-tagged full-length MyD88 shows extremely large filamentous polymers of MyD88 diffusing through the confocal volume. b The B parameter (brightness) correlates with the number of oligomers detected in typical time-traces as a function of protein concentration (nM), for the TIR domain (green), DD (blue) and wild-type full-length MyD88 (red). Protein concentrations range from 0 to 320 nM. Monomeric GFP (black) is included as a control. Inset: expansion of the signals obtained for the individual domains, over a lower concentration range. Fluorescence intensity time traces in a are representative traces obtained at > 200 nM protein concentrations. Values in b are from approx. 30 dilution experiments with the various protein concentrations and corresponding brightness values obtained plotted

