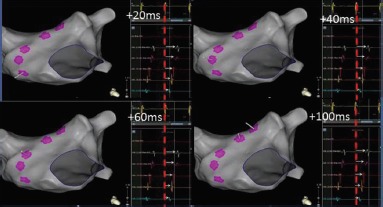
Figure 1: Electrogram Representation During a Ripple Map.

Five electrograms have been collected across the anterior wall of the left atrium during tachycardia and the location of each data point is projected on the anatomical shell. The Ripple Mapping algorithm aligns all of the electrograms from each point according to a stable fiducial reference signal. In this example, a coronary sinus signal (yellow electrogram) was chosen as reference. The system has aligned each of the five electrograms with the peak of the coronary sinus reference electrogram (highlighted here with a red dashed line). The Ripple Map for every electrogram collected is played through time (0–100 ms). Deflections (negative or positive) away from the isoelectric line from every mapped point are projected as a perpendicular white bar (white arrows). As time progresses, bars are seen to ascend up the anterior wall. When played quickly as a movie, this gives the impression of propagation as the bar movement progresses in relation to its neighbouring points.
