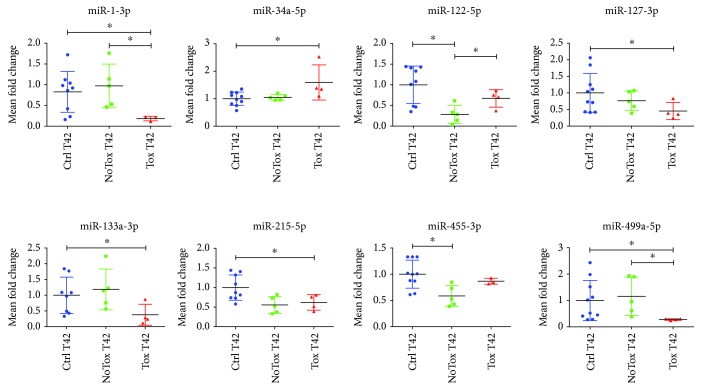
Figure 4.
Plasma miRNAs are regulated upon doxorubicin treatment. Eight miRNAs showed dysregulated expression upon DOX treatment (vs. CTRL). Data are depicted as scatter plots and expressed as mean fold change ± SD vs. CTRL, arbitrarily set to 1. Controls: blue dots, NoTox: green dots, Tox: red dots. ∗ p < 0.05. CTRL n = 10; NoTox n = 5; Tox n = 4.

