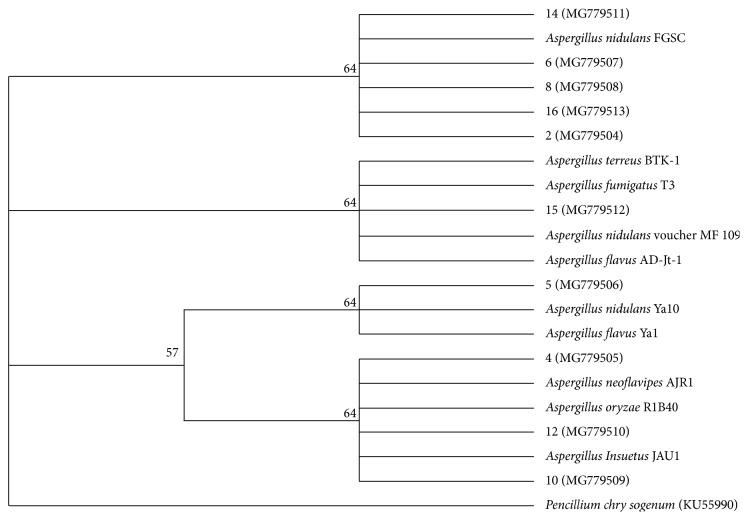
Figure 2.
Phylogenetic tree of fungal isolates based on 18S rDNA sequences. All screened fungal isolates have NCBI accession codes in brackets. The scale bar refers to 0.007 substitutions per nucleotide position. Bootstrap values obtained with 1000 resampling are referred to as percentages at all branches.

