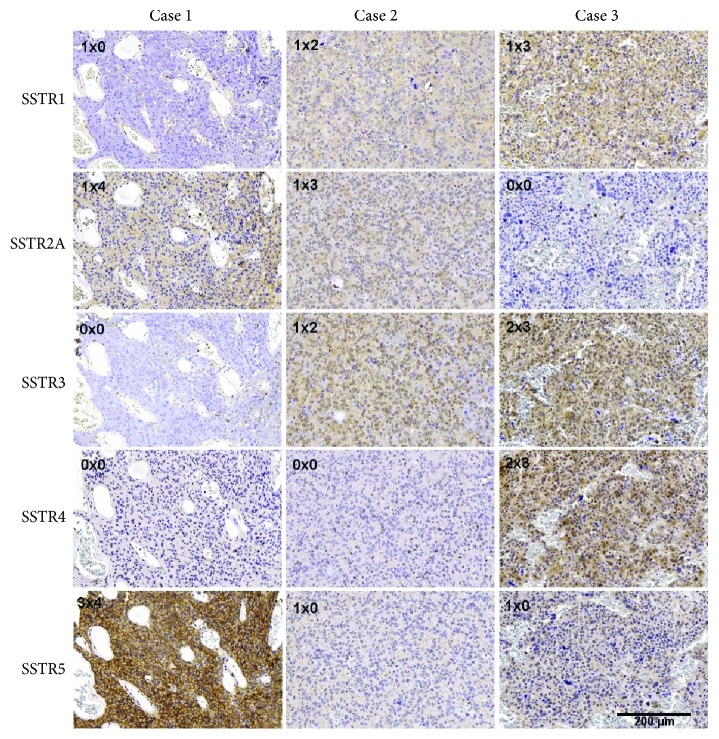
Figure 2.
Scoring of the SSTR expression according to Barresi et al. 2008 [27]. The intensity distribution (ID) score = immunostaining intensity (IS) × area of staining positivity (ASP) and is shown in the left upper corner. The examples show the expression of SSTR1, 2A, 3, 4, and 5 in three cases of corticotroph pituitary adenoma, ranging from 0 to the maximum ID score of 12.

