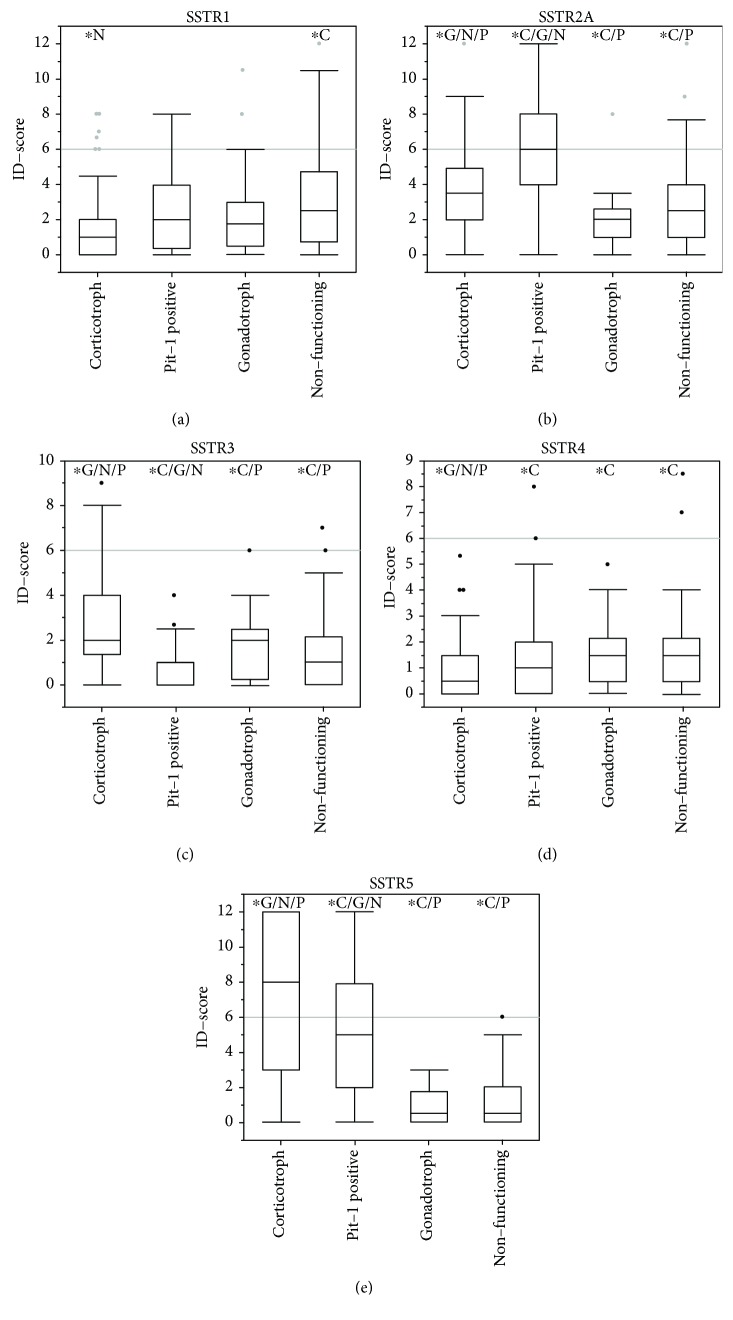
Figure 3.
Expression of SSTR1 (a), SSTR2A (b), SSTR3 (c), SSTR4 (d), and SSTR5 (e) in pituitary adenomas. Asterisks mark significant differences compared to other pituitary adenomas (corticotroph (C), gonadotroph (g), PIT-1-positive (P), and nonfunctioning pituitary adenomas (N)) according to Student's t-test with a significance of α < 0.05. Outliers are represented as single points and were included in each analysis.

