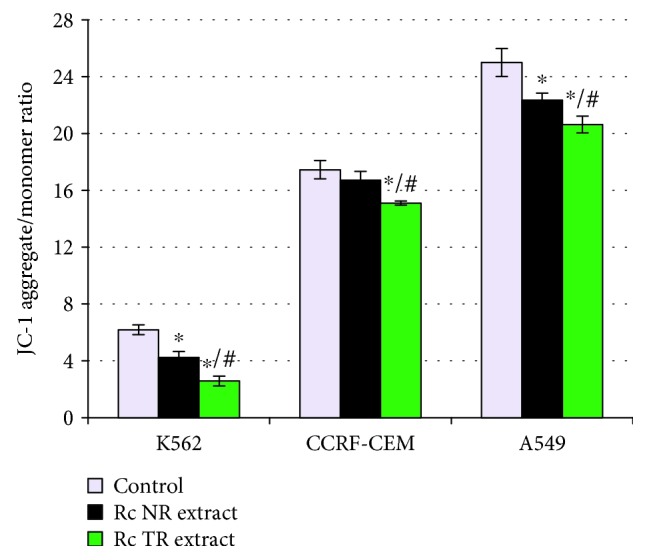
Figure 2.

The mitochondrial membrane potential in cell lines K-562, CCRF-CEM, and A549 after 24 h treatment with R. carthamoides extracts from the roots of soil-grown plants (Rc NR extract) and transformed roots (Rc TR extract). To measure mitochondrial membrane potential, the fluorescent dye JC-1 was used. Mitochondrial membrane potential is expressed as ratio of 530 nm/590 nm to 485 nm/538 nm (aggregates to monomer) fluorescence. The results represent mean ± SD of three independent experiments. Control: untreated cells. ∗p < 0.05 cells treatment with Rc NR extract or TR extract vs. control cells; #p < 0.05Rc NR extract vs. Rc TR extract.
