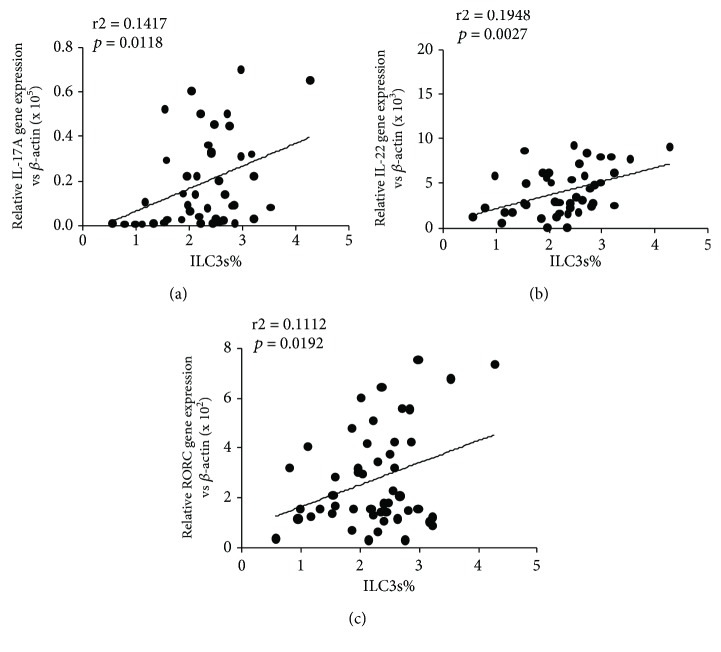
Figure 4.
Correlations between IL-17A, IL-22, and RORC levels and ILC3s. (a) The correlation of ILC3s% and IL-17A mRNA expression (p = 0.0118, r2 = 0.1417). (b) The correlation of ILC3s% and IL-22 mRNA expression (p = 0.0027, r2 = 0.1498). (c) The correlation of ILC3s% and RORC mRNA expression (p = 0.0166, r2 = 0.1385).

