
Figure 4.
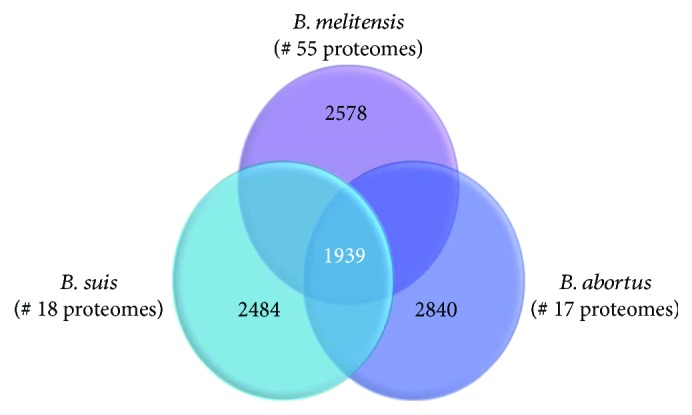
This Venn diagram shows the results of the pan-genome analysis of the three Brucella species. The numbers of genomes for each species are indicated. The number of core proteins for each species is shown in each corresponding circle, while the number of core proteins common for all the three species is shown in the intersection area.