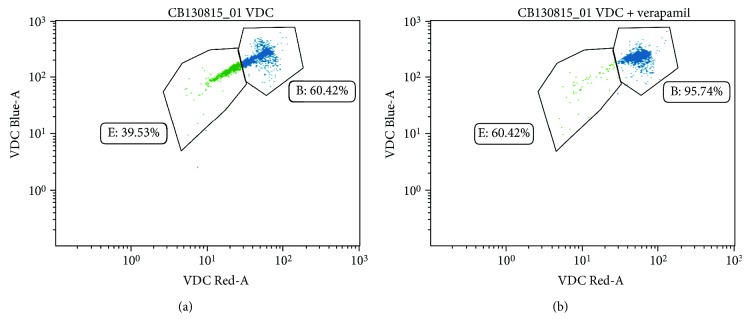
Figure 1.
Representation of the SP in flow cytometric dot plots. (a) Dot plot showing the fluorescence pattern of hematopoietic stem and progenitor cells (HSPCs) freshly isolated from the umbilical cord blood that has been stained and incubated with the fluorescent dye VDC Violet. The main population of cells (gate B) shows greater fluorescence intensity than the cells in the tail (gate E). This tail is known as the SP and represents a subpopulation of cell with greater efflux ability than the rest of the cells. (b) Dot plot showing the disappearance of the SP tail when HSPCs are incubated with VDC Violet and the ABC transporter blocker, verapamil. Cells that were part of gate E have now moved up to join the main population of cells. This is due to the blocking effect of verapamil, which prevents the dye from being effluxed by the cells.

