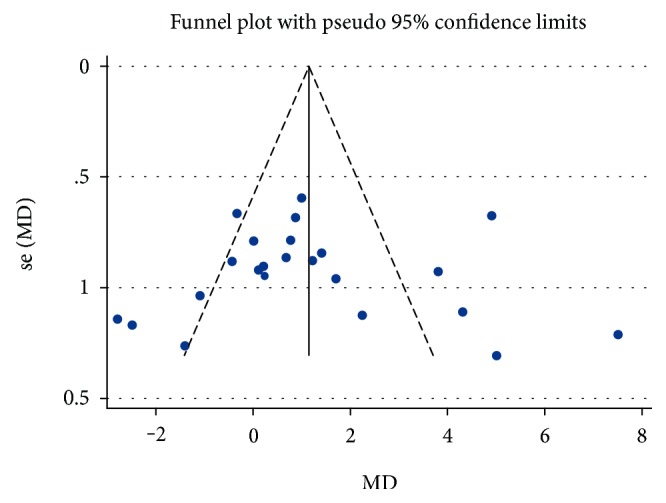
Figure 4.

Funnel plot and assessment of publication bias. Funnel plot with 95% pseudoconfidence intervals of the effect size and its standard error for studies assessing the effects of newer antidiabetic drugs on the primary endpoint endothelial function. Large studies appear toward the top of the graph and tend to cluster near the mean effect size. Smaller studies appear toward the bottom of the graph and (since there is more sampling variation in effect size estimates in the smaller studies) will be dispersed across a range of values. The symmetric distribution of studies about the combined effect size indicates the absence of publication bias.
