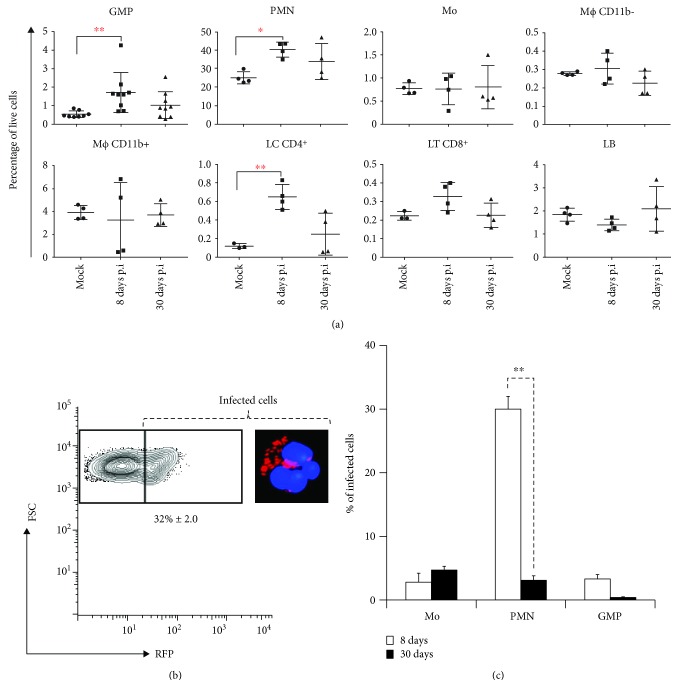
Figure 3.
Bone marrow leukocyte variation at different stages of infection. (a) BM cells from B. abortus-infected mice were collected and subjected to multiparameter flow cytometry analysis. Cells were identified according to the staining scheme (Table S1) and the percentage of each cell type determined in relation to all living cells of bone marrow at 8 and 30 days of postinfection. Values of ∗ p < 0.05 or ∗∗ p < 0.01 are indicated in relation to control noninfected mice at 8 and 30 days of postinfection. (b) Whole BM cells were collected and infected ex vivo with B. abortus-RFP. Infected cells were gated based on the RFP (red) positivity, and the total percentages of infected cells were quantified. (c) BM cells from B. abortus-RFP-infected mice were collected and subjected to multiparameter flow cytometry analysis. Infected cells were gated based on the RFP (red) positivity, identified and quantified according to the staining scheme (Table S1) at 8 a 30 days of postinfection. Each bar is the mean (±1 SD) of an experiment. Values of ∗∗ p < 0.01 are indicated.

