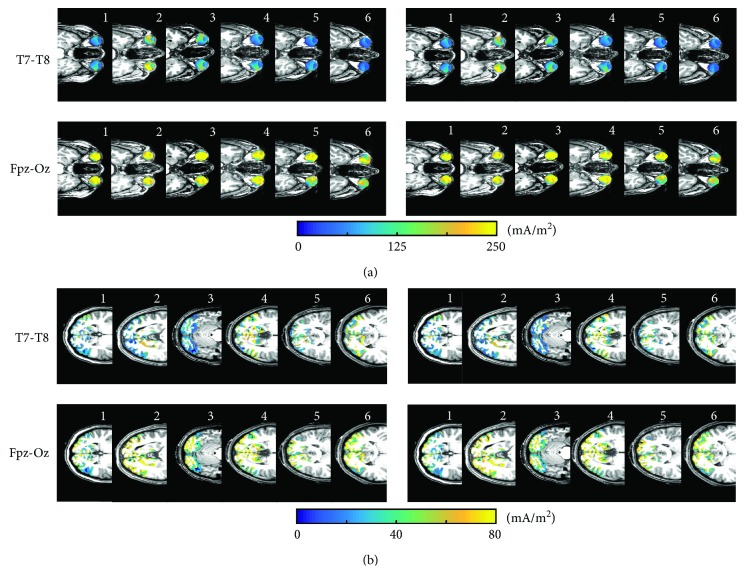
Figure 3.
Predicted current density distributions in the central axial slice of individual ROIs. Images showing simulated current density maps for isotropic (left) and anisotropic (right) models in (a) EYE and (b) occipital lobe (OCC) ROIs. Subject numbers are shown in the top right corner of each current density image.

