Fig. 4.
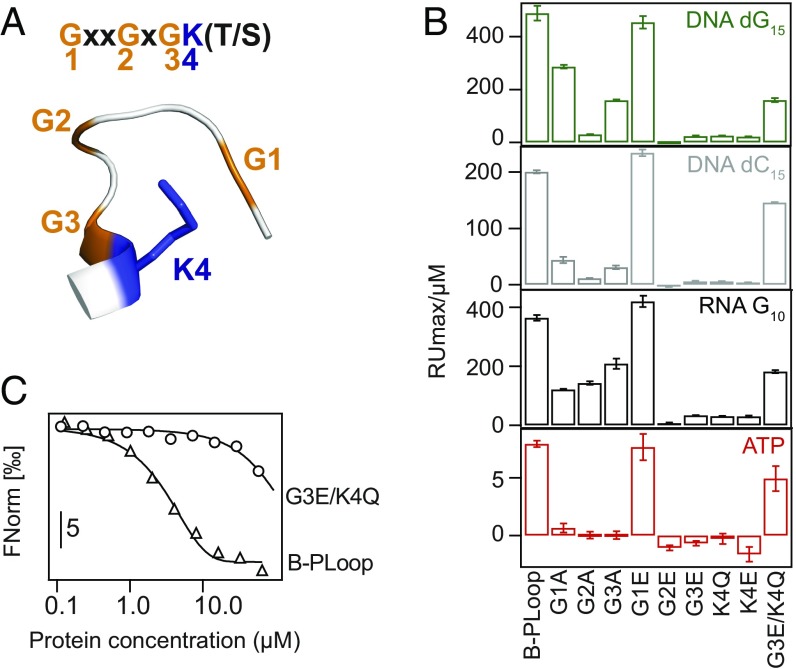
P-loop residues mediate ligand binding. (A) Schematic representation of the Walker-A motif. (B) Binding of B-PLoop and its mutants to ssDNA, RNA, and ATP, assayed by SPR. Shown are the initial slopes derived from plots of maximal RU versus protein concentration (as in Fig. 3D). (C) MST profiles of the titration of dC15 with B-PLoop and its double mutant. The lines represent a fit to sigmoidal binding curves.

