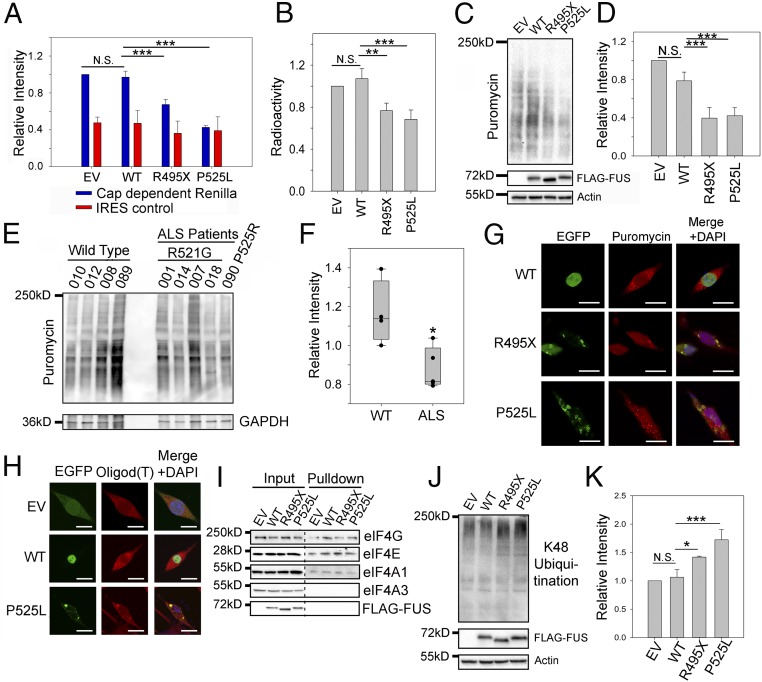
Fig. 2.
Protein translation is impaired in the presence of mutant FUS. (A) Cap-dependent translation assay using the luciferase reporter in N2a cells expressing EV, WT, or mutant FUS. Blue and red bars represent the luminescence of the Renilla cap-dependent reporter and the Firefly luciferase transfection control, respectively. (B) In vitro 35S-Met incorporation assay using rabbit reticulocyte lysate mixed with N2a cell lysate containing EV, WT, or mutant FUS. After 1 h of incubation, proteins were precipitated and radioactivity was measured using a scintillation counter. Counts were normalized to the EV. (C and D) SUnSET assay measuring puromycin incorporated into proteins during translation in N2a cells expressing EV, WT, or mutant FUS. Western blots of puromycinylated proteins, FUS, and actin loading control are shown in C. Quantification in D was performed using the intensity of puromycinylated proteins in each lane to normalize against actin and EV. (E and F) SUnSET assay measuring puromycin incorporated into proteins during translation in fibroblast cells of patients with FUS ALS. Western blots of puromycinylated proteins and a GAPDH loading control are shown in E, and quantification results are shown in F. (G) Immunofluorescent staining of puromycinylated proteins in N2a cells expressing EV or EGFP-tagged WT or mutant FUS. Cells were incubated with puromycin for 30 min, fixed using paraformaldehyde (PFA), and stained with the antipuromycin antibody. (Scale bars: 20 μm.) (H) RNA FISH using a Cy3-tagged 21-mer oligo d(T) probe in N2a cells expressing WT or mutant FUS. (Scale bars: 20 μm.) (I) 7′MG pulldown to assess the cap binding and protein translation initiation in N2a cell lysate containing WT or mutant FUS. Various initiation complex members (eIF4E, eIF4G, and eIF4AI), FUS, and a negative control (eIF4AIII) were blotted. (J) K48 polyubiquitination in N2a cells expressing EV, WT, or mutant FUS with FUS expression and actin loading control. (K) Quantification of J using the K48 polyubiquitination intensity in each lane to normalize against actin and EV. Error bars in the figure represent SDs for three biological replicates. *P ≤ 0.05; **P ≤ 0.005; ***P ≤ 0.001. N.S., not significant. ANOVA with a post hoc Tukey honest significant difference test was used to determine P values for multiple pairwise comparisons in A, B, D, and K. A Student’s t test was used to determine P values for simple pairwise comparison in F.

