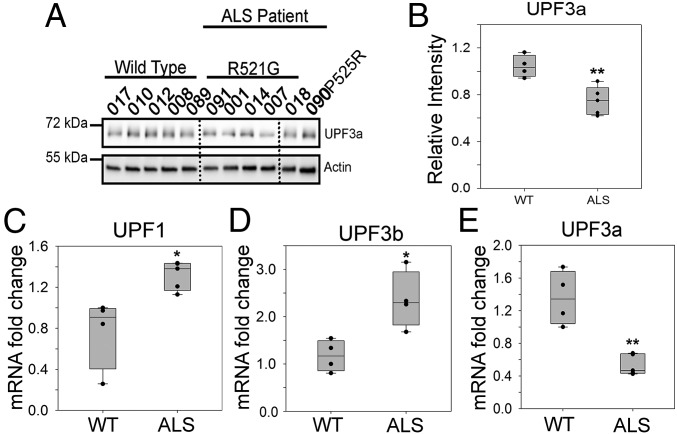
Fig. 5.
Down-regulation of the NMD negative regulator UPF3a in cells of patients with familial ALS. (A and B) Protein levels of the NMD negative regulator UPF3a in six patients with ALS and five control subjects, as shown in Fig. 3 A and B. Western blots of UPF3a and an actin control (A) and quantification of UPF3a normalized against actin (B) are shown. (C–E) Quantification of mRNA levels of dysregulated NMD factors. qPCR of UPF1 (C), UPF3b (D), and UPF3a (E) was performed using the cycle threshold method and is presented as the fold change in patients with ALS versus controls. Actin was used to normalize cycle threshold values. Error bars represent the SD between individuals. *P ≤ 0.05; **P ≤ 0.005. Quantifications were compared with healthy controls using a Student’s t test.

