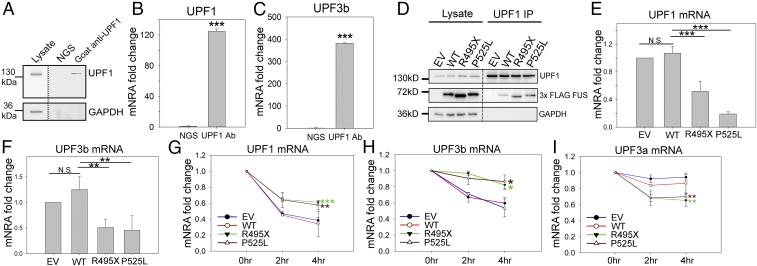
Fig. 6.
Disruption in the NMD autoregulation loop. Endogenous UPF1 IP from N2a cells was performed, followed by Western blot (A) and qPCR measurement of UPF1 (B) and UPF3b (C) mRNAs. N2a cell lysate was subjected to IP using normal goat serum (NGS) or goat anti-UPF1 antibody. The IP samples were aliquoted for Western blot (A) and qPCR quantification (B and C) comparing RNA coprecipitated with UPF1 protein versus NGS control. UPF1 IP from N2a cells expressing EV, WT, or mutant FUS was performed, followed by Western blot (D) and qPCR measurement of UPF1 (E) and UPF3b (F) mRNAs. UPF1, FUS, and GAPDH were assessed by Western blot, as shown in D. qPCR quantification was normalized to UPF1 protein precipitated and presented as fold change compared with EV. Turnover rates of UPF1 (G), UPF3b (H), and UPF3a (I) mRNAs in N2a cells expressing EV, WT, or mutant FUS are shown. Actinomycin D or DMSO control was added 2 or 4 h before harvesting for RNA isolation. Individual mRNAs of interest were quantified by qPCR, normalized against RPL13a, and presented as fold change versus DMSO treatment over time. Error bars represent the SD from three replicates. *P ≤ 0.05; **P ≤ 0.005; ***P ≤ 0.001. N.S., not significant. ANOVA with a post hoc Tukey honest significant difference test was used in E–I, and a Student’s t test was used in B and C.

