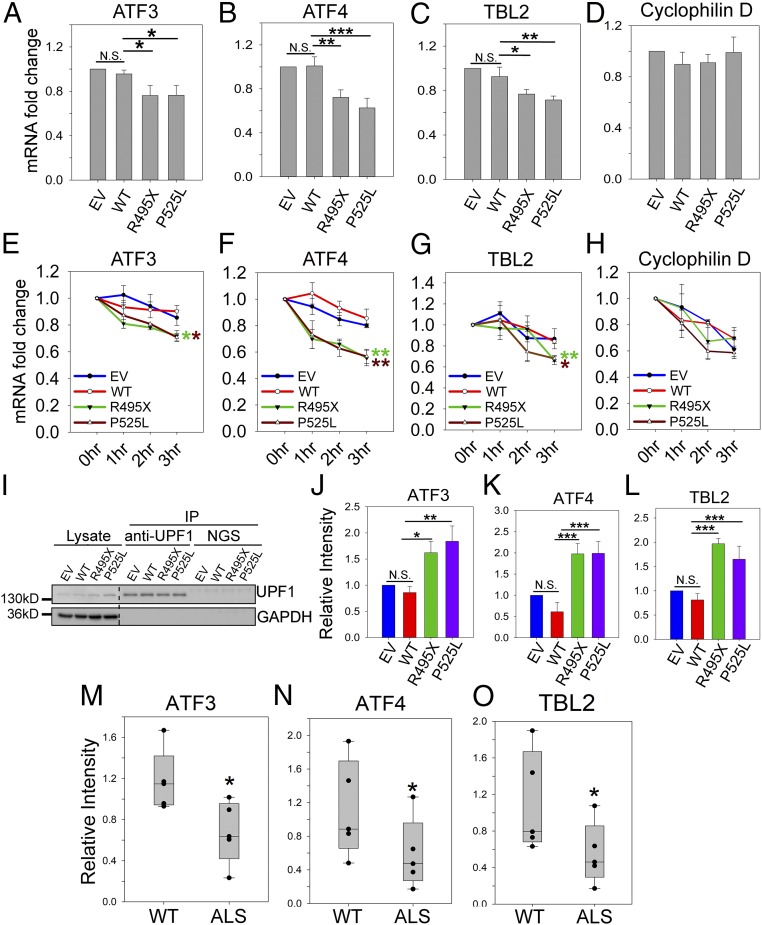
Fig. 7.
Enhanced NMD activity in the presence of mutant FUS. The mRNA levels of ATF3 (A), ATF4 (B), TBL2 (C), and cyclophilin D (D) in N2a cells transfected with EV, WT, or mutant FUS were determined. The levels of the indicated mRNA were quantified by qPCR using the cycle threshold (ΔΔCT) method, and the fold changes compared with WT are presented. Turnover rate of ATF3 (E), ATF4 (F), TBL2 (G), and cyclophilin D (H) mRNAs in N2a cells expressing EV, WT, or mutant FUS after treatment with actinomycin or DMSO control. Individual mRNAs of interest were quantified by qPCR, normalized against RPL13a, and presented as fold change versus DMSO treatment over time. Error bars represent the SD from three replicates. (I–L) Amount of ATF3, ATF4, and TBL2 mRNA bound to the UPF1 protein. N2a cells were cotransfected with EV, WT, or mutant FUS and an NMD reporter as indicated. After UPF IP, Western blot (I) demonstrates levels of UPF1 in lysate and IP samples. The levels of ATF3 (J), ATF4 (K), and TBL2 (L) mRNA in the UPF1 IP samples were quantified by qPCR using the ΔCT method. The fold changes normalized to WT are presented from three replicates. The mRNA levels of ATF3 (M), ATF4 (N), and TBL2 (O) in fibroblast cells derived from patients with familial ALS carrying FUS mutations and healthy WT controls are shown. *P ≤ 0.05; **P ≤ 0.005; ***P ≤ 0.001. N.S., not significant. ANOVA with a post hoc Tukey honest significant difference test was used to determine P values in A–L. A Student’s t test was used to determine P values in M–O.

