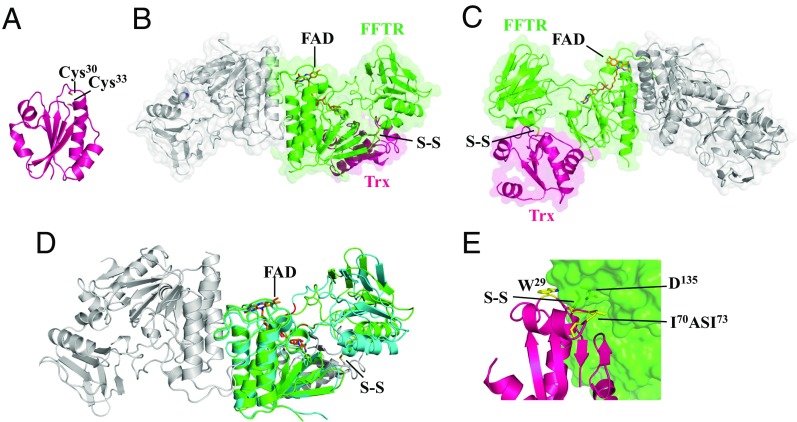
Fig. 2.
Crystal structure of C. acetobutylicum Trx and FFTR−Trx complex. (A) Ribbon drawing representation of CaTrx2. (B) Ribbon drawing representations with semitransparent surface of the CaFFTR2−CaTrx2 complex, with one monomer of FFTR (green) bound to one Trx molecule (magenta) and the rest of the complex colored in gray. (C) A view rotated ∼180° about the vertical axis relative to B. Loops missing in the electron density map in Trx are indicated as dotted lines. (D) Comparison of FFTR free (blue) and in complex with Trx (FFTR in green and Trx in gray; the disulfide bond is indicated) for one monomer. Hinge region forming part of the two joining loops is shown in red. (E) Details of FFTR−Trx binding interface. Trx residues interacting with FFTR are shown as sticks and labeled. A hydrophobic loop [residues 70 to 73: Ile-Ala-Ser-Ile (IASI), in yellow] in CaTrx2 fits into a surface cleft of the redox-active disulfide domain of CaFFTR2. The FAD cofactor is represented in sticks, with carbons in orange.

