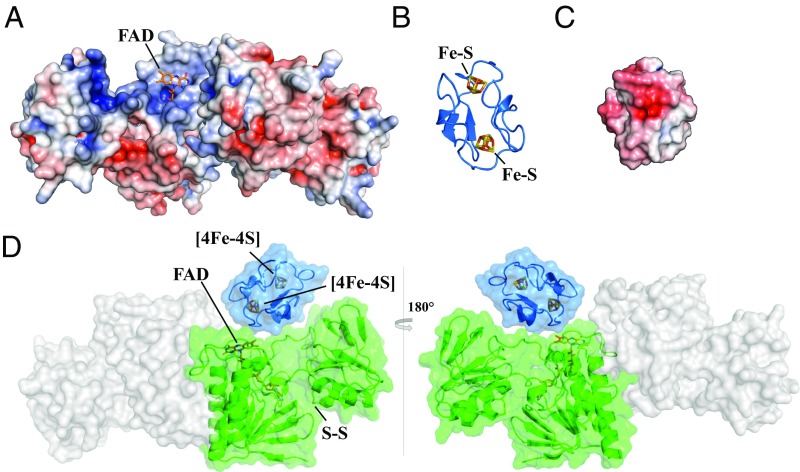
Fig. 3.
Model of Fdx interaction with FFTR. Electrostatic potential surfaces are colored in red for negative and blue for positive on a scale from −5 kT/e to +5 kT/e; uncharged residues are uncolored. (A) The electrostatic potential mapped onto the FAD solvent-accessible surface of CaFFTR2 in a view as in Fig. 1B. (B) A homology model of C. acetobutylicum Fdx using C. pasteurianum Fdx as template (Protein Data Bank ID code 1clf). Target and template proteins share 90% amino acid sequence identity. (C) The electrostatic potential map of CaFdx in a view as shown in B. (D) Fdx−FFTR complex model based on charge and shape complementary. One Fdx (blue ribbon diagram) is docked to a monomer of FFTR (green surface) at the interface of the two domains. The model is rotated 180° between Left and Right.

