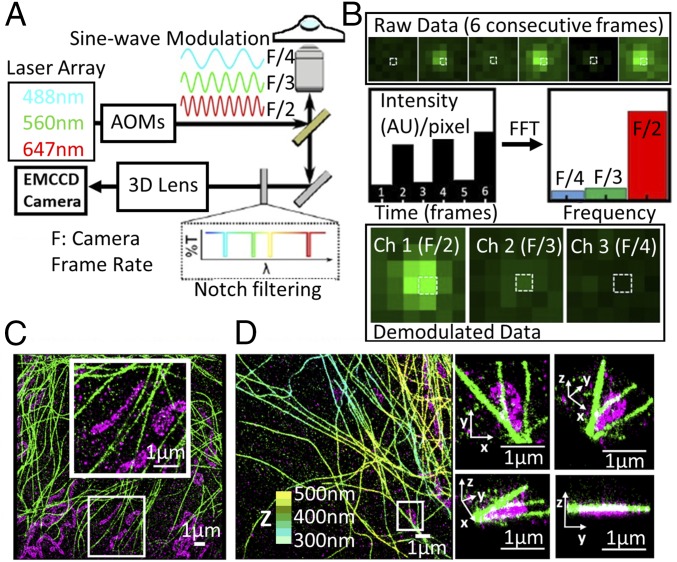
Fig. 1.
fm-DNA-PAINT concept. (A) Schematic of the microscope setup and imaging method. An example case of three illumination lasers are shown as sinewave-modulated at three different frequencies, F/2, F/3, and F/4, where F is the camera frame rate. (B) Representative example of data processing. (B, Top) SubROI of six consecutive frames with one fluorophore present. (B, Middle) Intensity evolution of the selected pixel (white box) in the time domain and amplitudes in the frequency domain after a FFT over the six frames. (B, Bottom) Resulting demodulated data split into the three different channels. (C) Two-Color, 2D fm-DNA-PAINT image of mitochondria (magenta) and microtubules (green). (D) Two-Color 3D fm-DNA-PAINT image of mitochondria and microtubules. Zooms on the right show 3D views of the white boxed region. Mitochondria are represented in magenta. For the microtubules, the color-coding indicates z-position (from 300 nm in light blue to 500 nm in yellow).

