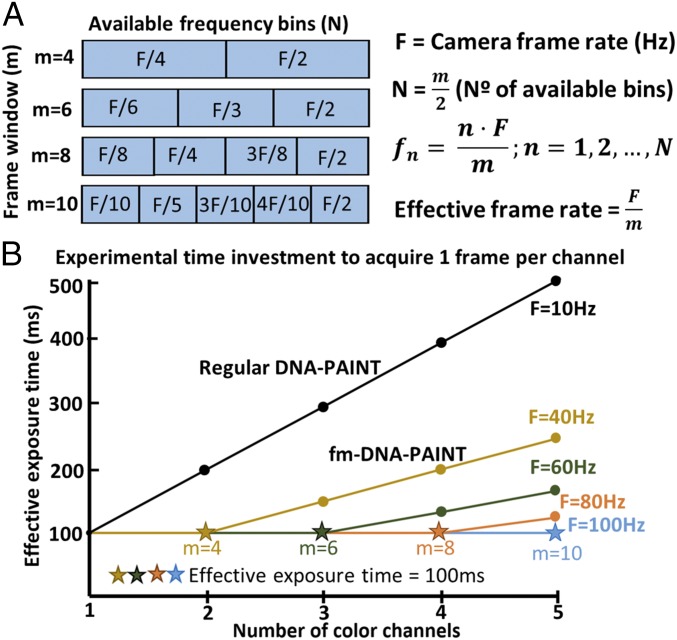
Fig. 2.
Multicolor fm-DNA-PAINT dramatically improves experimental time investment compared with sequential multicolor DNA-PAINT. (A) Scheme showing the available frequency bins fn (and thus the number of colors) for a given demodulation frame window size m. (B) Effective exposure time versus the number of color channels for different camera frame rates F. The black line shows conventional DNA-PAINT where multicolor imaging is performed sequentially, assuming an exposure time of 100 ms per color (i.e., F = 10 Hz).

