Fig. 3.
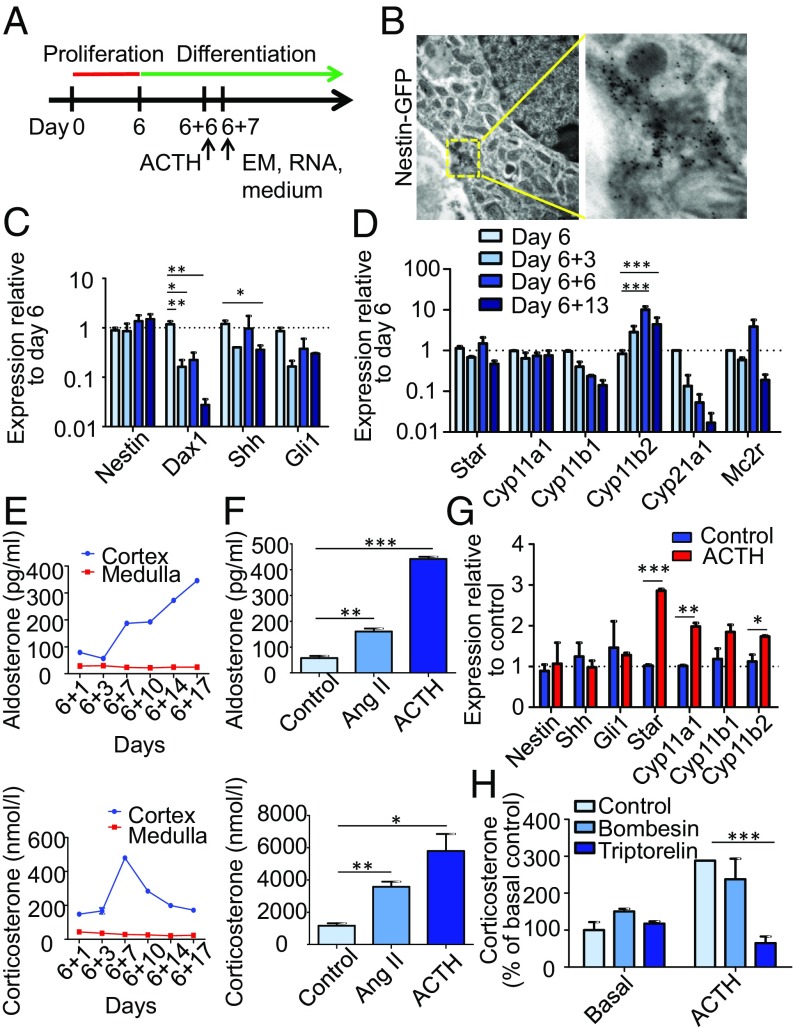
In vitro differentiation of adrenocortical progenitors. (A) Adrenocortical cells isolated from Nestin-GFP mice were allowed to proliferate for 6 d before differentiation was induced. (B) EM image shows Immunogold labeling of GFP on day 7 of differentiation. (C) qRT-PCR depicts the relative expression of stem cell markers and (D) steroidogenic markers plus the ACTH receptor at different time points following culture in differentiation conditions. (E) Aldosterone and corticosterone levels in the media as measured by ELISA. (F) Aldosterone and corticosterone levels after 6 d of differentiation and exposure to Ang II or ACTH for 24 h. (G) qRT-PCR shows the relative expression of stem cell and steroidogenic markers in ACTH-treated cells compared with control cells. (H) Corticosterone levels in control and ACTH-stimulated cells treated with triptorelin and bombesin. Data in C, D, and F–H are presented as mean ± SEM (n ≥ 3). *P < 0.05; **P < 0.01; ***P < 0.001.

