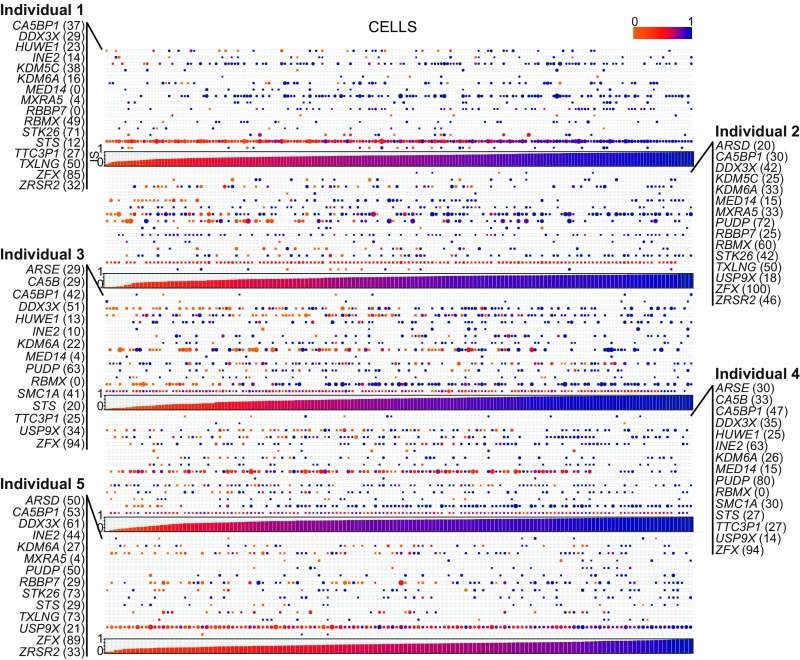
Fig. 2.
Single-cell ASE profile of 22 robust escapee genes in human female fibroblasts. Composite figure of individual ARs per gene per cell (Top). AR profile of robust escapee genes (listed the rows) with a detectable expression in single cells (ordered along the columns) is shown. Every dot represents the AR of the respective gene in a cell. AR ranges from 0 (light orange) to 1 (dark blue). The size of the dot is proportional to the respective number of reads detected per cell. %, the percentage of cells where the respective gene is escaping XCI. (Bottom) Bar plot representing the IS (see text for details) per cell. IS ranges from 0 (light orange) to 1 (dark blue).

