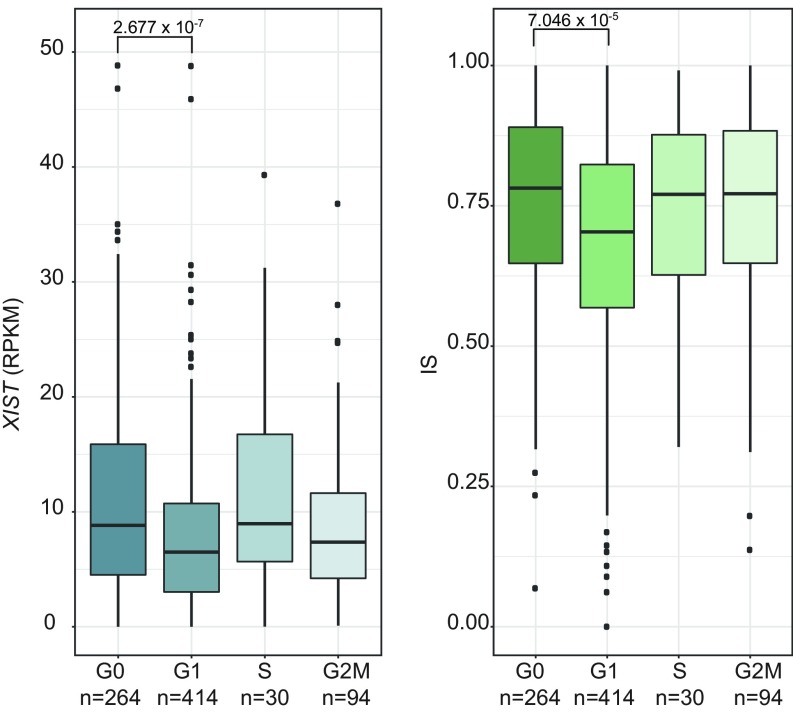
Fig. 5.
XIST expression and IS dependency on the cell cycle. Distribution of XIST expression (Left) and of ISs per single cells (Right) according to cell-cycle phases (n = number of cells per stage). P values calculated with Mann–Whitney U test (see Materials and Methods for details).

