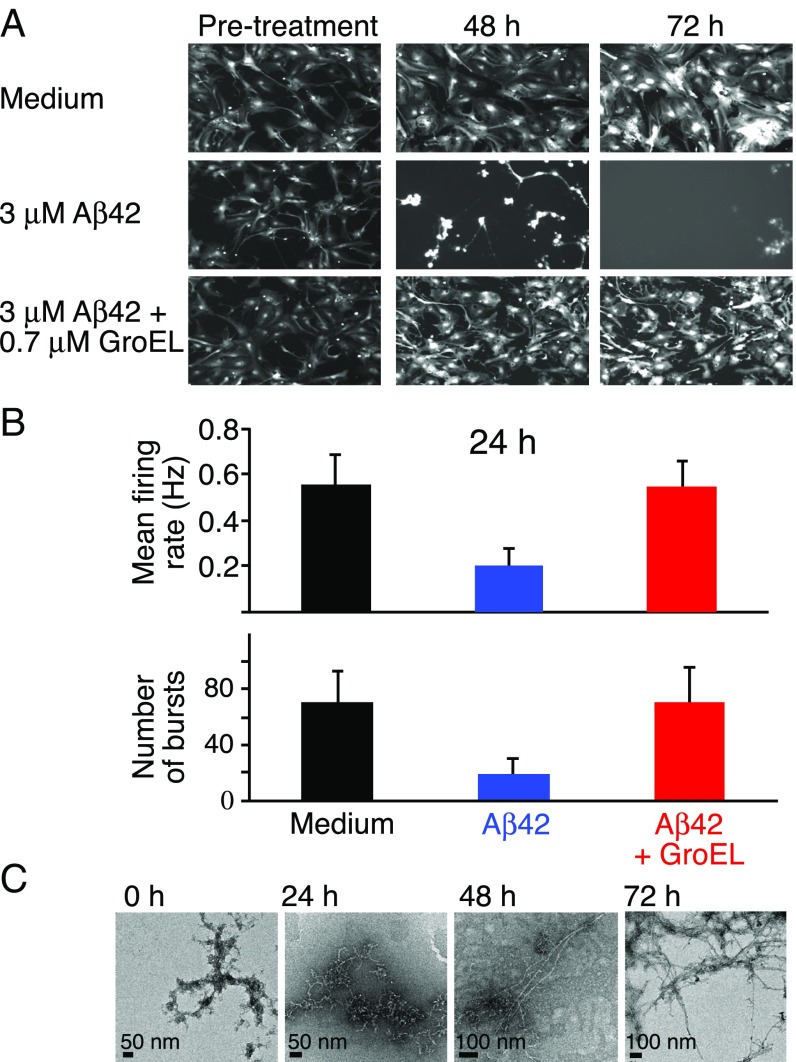
Fig. 2.
Images of neuronal cell cultures and electrophysiology. (A) Neurons containing the fluorescence label Td-Tomato were imaged at 6-h time intervals. The Top, Middle, and Bottom rows show some of the images with medium only, 3 μM Aβ42, and 3 μM Aβ42 plus 0.7 μM GroEL, respectively. (Magnification: 10×.) (B) Mean firing rate (Top) and number of bursts (Bottom), measured over a 5-min time frame, of neuronal cell cultures at 24 h for medium only (black), and upon addition of 3 μM Aβ42 in the absence (blue) and presence (red) of 0.7 μM GroEL. Error bars represent 1 SD. (C) Corresponding electron micrographs of Aβ42 at various points in time up to 72 h. Aβ42 was dissolved in 20 mM sodium phosphate buffer (pH 7.4) to a concentration of 300 μM and left for 3 d at 4 °C; the sample was then diluted to 3 μM (0 h) and incubated (in the absence of GroEL) at 37 °C for a total of 72 h.

