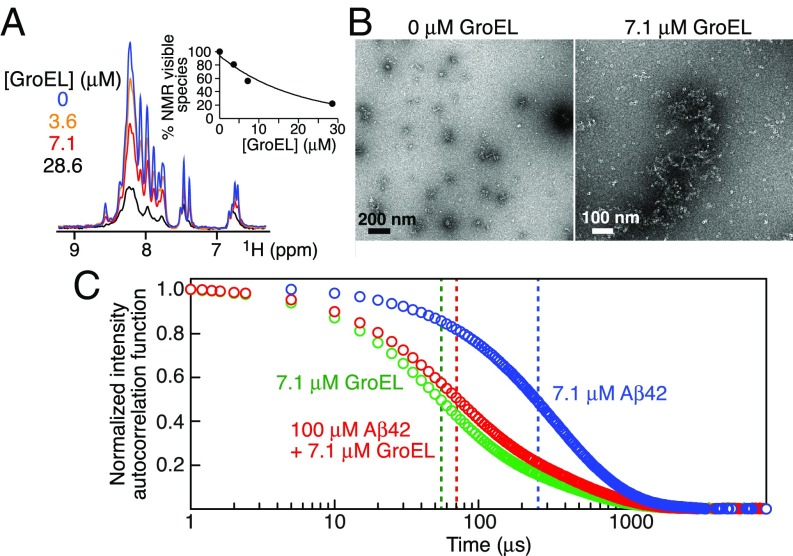
Fig. 3.
Interaction of Aβ42 with GroEL during the initial steps of Aβ42 aggregation. (A) Fourier transform of the free induction decay (FID) of the first t1 increment of a 1H–15N correlation experiment recorded on 100 μM 15N-labeled Aβ42 at 10 °C immediately (time point zero) upon adding 0–28.6 μM GroEL. The Inset shows the overall decrease in the integrated intensity of the backbone amide proton envelope (7.6–8.8 ppm) of the Aβ42 NMR spectrum as a function of GroEL concentration. (B) Electron micrographs of 100 μM Aβ42 in the absence and presence of 7.1 μM GroEL: small aggregates (<200-nm length) of Aβ42 are seen in the absence of GroEL but are undetectable by EM in the presence of GroEL where only GroEL particles are observed. (C) DLS normalized intensity autocorrelation functions (g(2) − 1) obtained immediately after dilution at room temperature (19 °C) of 7.1 μM GroEL (green), 100 μM Aβ42 (blue), and 100 μM Aβ42 plus 7.1 μM GroEL (red). The vertical dashed lines indicate the apparent decay times (t1/2).

