Fig. 6.
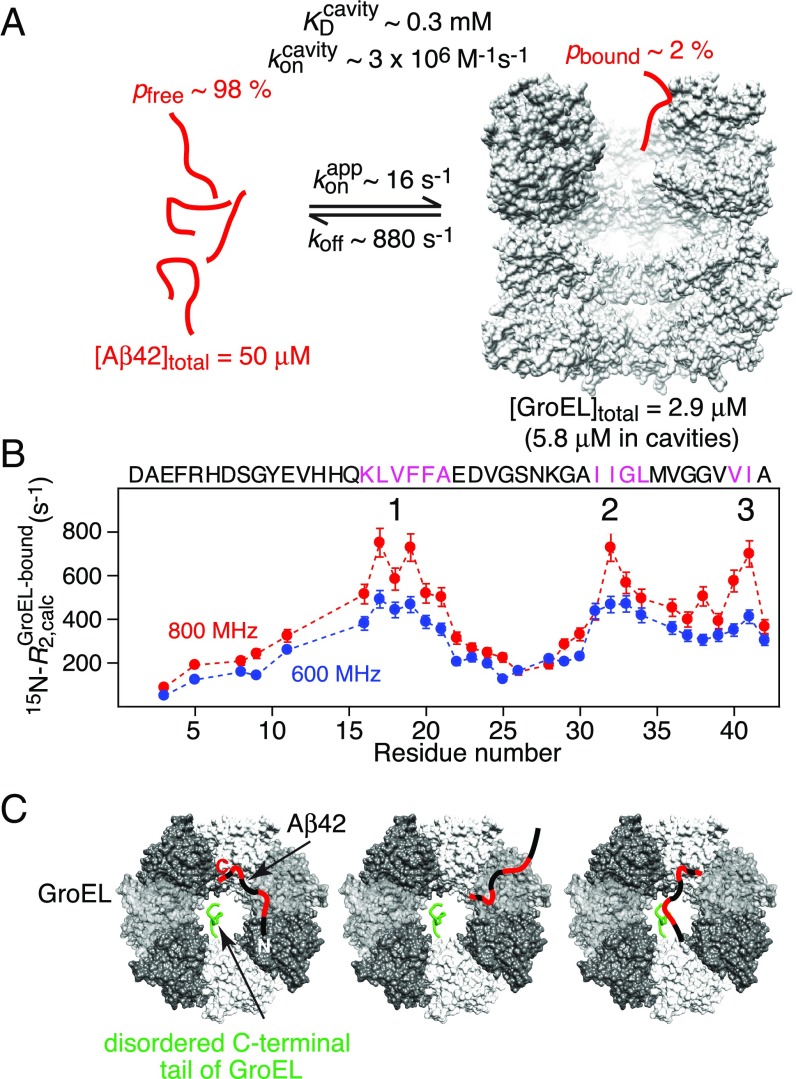
Results of the analysis of the relaxation-based NMR experiments on the interaction of Aβ42 with GroEL at 5 °C. (A) Summary of kinetic parameters obtained upon globally best fitting all NMR relaxation-based data to a two-site exchange model (Fig. 5). Note that the NMR experiments are carried out at equilibrium and analyzed in terms of exchange between two species, free and bound Aβ42; hence is an apparent pseudo–first-order association rate constant in units of per-second that pertains to the specific concentrations of Aβ42 and GroEL used in the NMR experiments. (B) 15N- profiles for Aβ42 bound to GroEL obtained from the global fits. The three anchor regions (labeled 1–3) for binding to GroEL correspond to residues with the highest 15N- values, highlighted by the magenta colored sequences, and lie within the GroEL-binding consensus sequences (Fig. 5A). (C) Schematic depicting various potential modes of interaction of Aβ42 with GroEL, all of which interconvert on a timescale shorter than the lifetime of the complex (∼1 ms). The residues of Aβ42 primarily interacting with GroEL are colored red, the individual subunits of GroEL are shown in different gray scale, and the disordered C-terminal tail of GroEL from one subunit is depicted in green. The spacing between GroEL-binding region 1 and the two other binding regions on Aβ42 is sufficient to permit binding to two adjacent subunits simultaneously; in addition, the disordered glycine/methionine-rich C-terminal tail of GroEL can also potentially make contact with Aβ42.

