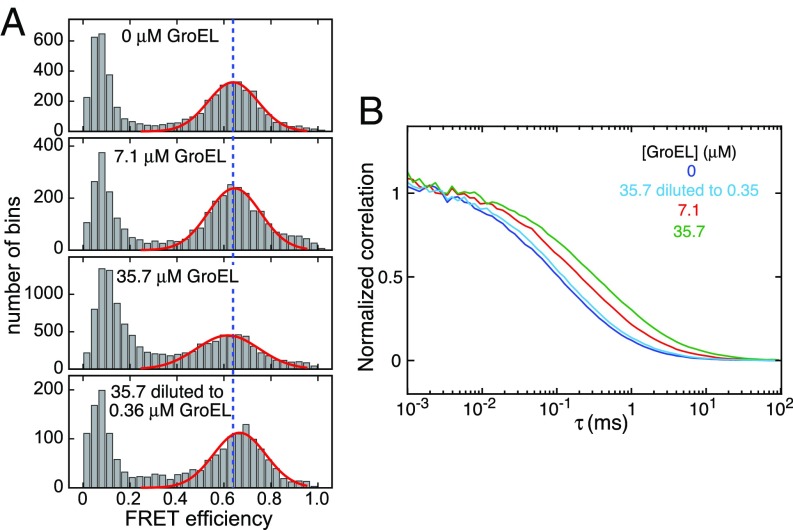
Fig. 7.
Probing the interaction of Aβ42 with GroEL by single-molecule FRET. (A) FRET efficiency histograms and (B) donor–acceptor signal cross-correlation curves recorded on 100 pM Aβ42 labeled with two fluorophores (donor, Alexa 488; acceptor, Alexa 647) in the presence of 0–35.7 μM GroEL. The Bottom in A and the light blue curve in B show the data obtained on a sample of 10 nM Aβ42 incubated with 35.7 μM GroEL and then diluted 100 times to 100 pM Aβ42 and 0.36 μM GroEL. The red solid lines in A are the fitted FRET efficiency distributions; the blue dashed line is drawn at a FRET efficiency value of 0.64. All single-molecule FRET experiments were conducted at room temperature (22 °C).

