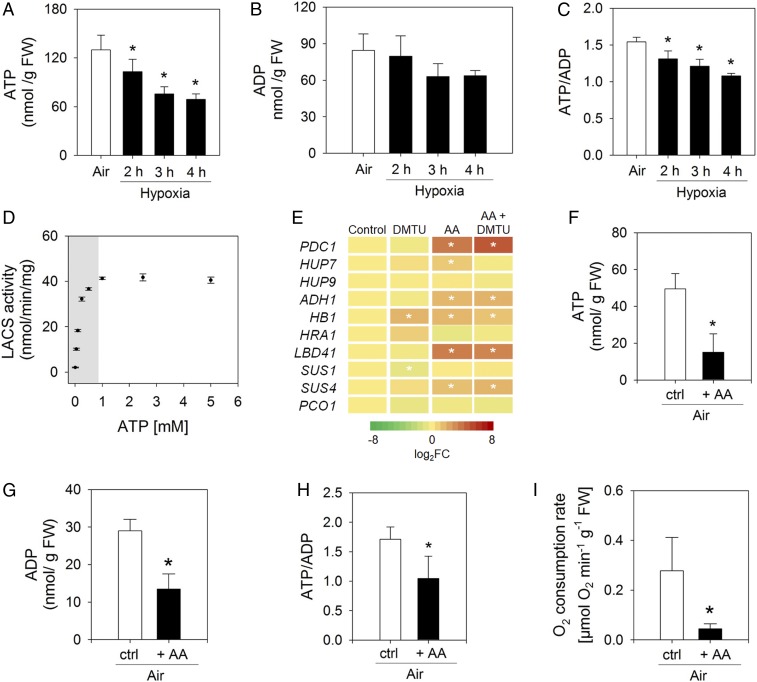
Fig. 5.
Decreasing the cellular ATP level constitutes limiting conditions for LACS activity and induces the expression of low-oxygen responsive genes. (A) ATP levels under hypoxia (mean ± SD, *P < 0.05, n = 5). (B) Concentration of ADP in wild-type seedlings grown under long-day conditions and exposed to hypoxia. Data shown are given in nanomoles per gram fresh weight and represent the mean ± SD of independent replicates (n = 5). (C) ATP-to-ADP-ratio under hypoxia (mean ± SD, *P < 0.05, n = 5). (D) In vitro LACS activity depends on ATP concentration (mean ± SD, *P < 0.05, n = 5). The gray area marks the ATP-concentration range usually determined in plant cells. (E) Differential expression of hypoxia-responsive genes after 3 h of 1 mM DMTU and/or 50 µM antimycin-A (AA) treatment under aerobic conditions (reference: mock-treated control). Data are presented as mean ± SD, *P < 0.05, n = 5. (F) ATP levels after 3 h of 50 µM AA treatment (mean ± SD, *P < 0.05, n = 5). (G) Concentration of ADP in wild-type seedlings exposed to 3 h of 50 µM AA treatment. Data represent mean ± SD (n = 5). Asterisk indicates significant differences after one-way ANOVA (P < 0.05). (H) ATP-to-ADP-ratio after 3 h of 50 µM AA treatment (mean ± SD, *P < 0.05, n = 5). (I) Oxygen consumption rate in wild-type leaves upon 3 h of 50 µM AA treatment. Data represent mean ± SD (n = 7). Asterisk indicates significant difference after Student’s t test (P < 0.05).

