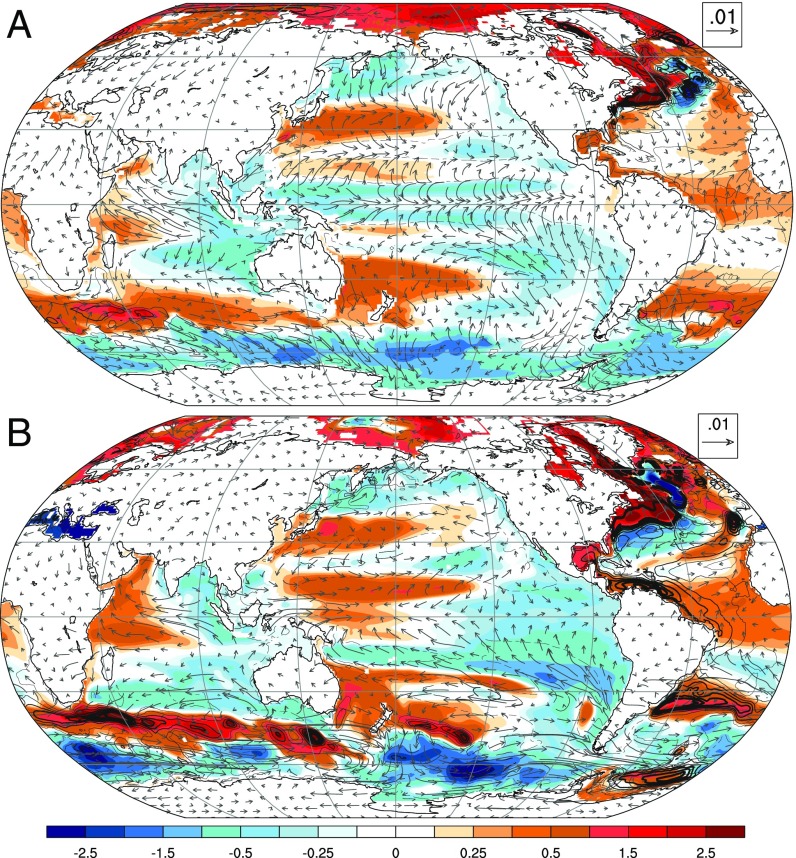
Fig. 2.
The 1993–2018 FR in sea level (millimeters per year; global mean removed), near-surface winds (vectors; meters per second per year; mean retained), and ocean heat content (contour lines; spacing of 107 J/m2 per year) estimated from ensemble mean trends in (A) the CESM and (B) the ESM2M. Heat content changes are shown as a function of depth and in greater detail in SI Appendix, Figs. S8, S10, and S11.

