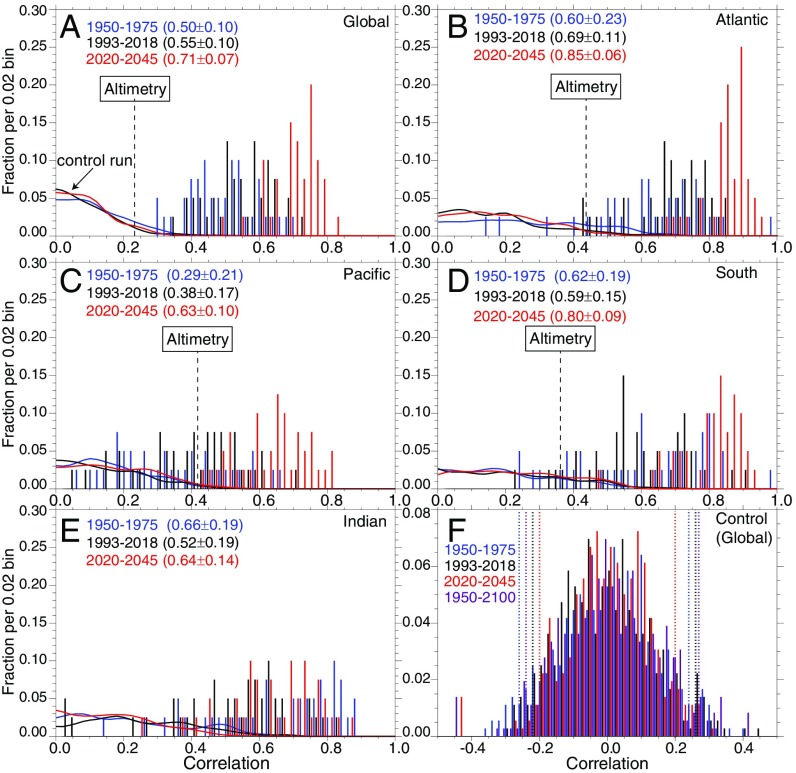
Fig. 4.
Histograms of the fractional occurrence of pattern correlations in the CESM LE of individual member trends across various eras with their contemporaneous FRs for (A) the global ocean and (B) Atlantic, (C) Pacific, (D) Southern, and (E) Indian Ocean basins (associated ocean boundaries are shown in Fig. 1A). Colored lines in A–E correspond to occurrences obtained for the FR from the three eras in the control run (for the globe shown in detail in F). Dashed lines in F correspond to 95% confidence intervals for pattern correlations in the control run. Also shown in A–D are the pattern correlations of the 1993–2018 FR with observed altimeter trends smoothed to spectral wavenumber 42 [omitted for the Indian Ocean, where the correlation is negative (−0.29)]. Plotted fractional occurrence does not sum to unity where members with negative values exist.

