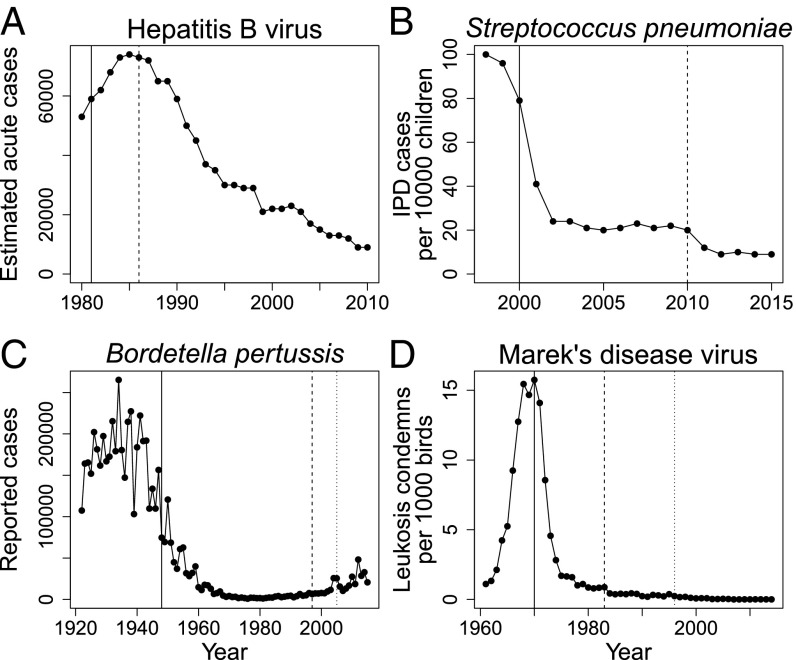
Fig. 2.
(A–D) Disease incidence before and after vaccine introductions for four of our case-study pathogens. Analogous data are unavailable for Y. ruckeri and avian metapneumovirus. All data reflect disease dynamics in the United States. Solid lines denote the approximate introduction of first-generation vaccines. Dashed and dotted lines denote the approximate introduction of second- and third-generation vaccines, respectively. Updates to the hepatitis B and pertussis vaccines were made in response to concerns of vaccine safety, not pathogen evolution. Disease dynamics are driven by many factors in addition to vaccines and vaccine resistance, and so not all declines in disease can be attributed to vaccination. We nevertheless note that in A–D, disease rates have never returned to prevaccination levels despite the emergence of vaccine resistance. Data in A–C are compiled from the Centers for Disease Control (137–139). Data in D are compiled from the USDA Poultry Slaughter Reports (107).

