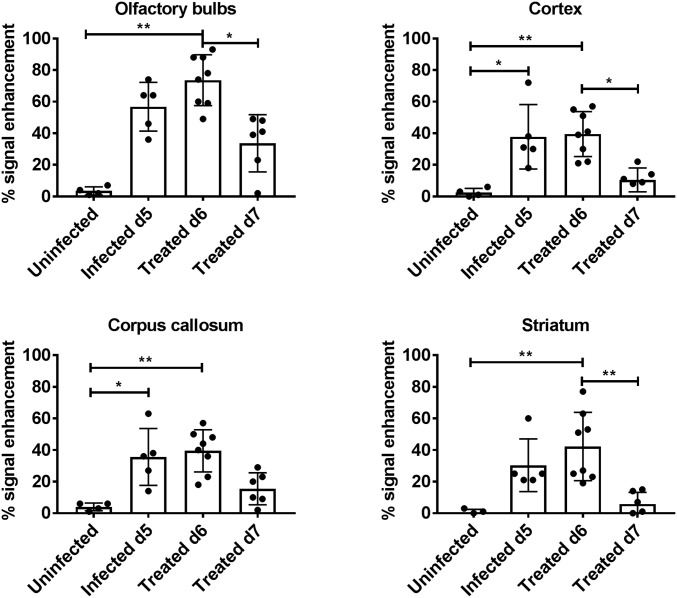
Fig. 4.
Quantification of cross-sectional T1 signal enhancement (between pre- and postcontrast images) in different regions of the brain. Cross-sectional T1 values shown are for uninfected mice (n = 4), day 5 p.i. mice (n = 5, average clinical score = 3); post initial treatment, day 6 p.i. mice (n = 8, average clinical score = 4); and post second treatment day 7 p.i. mice (n = 6, average clinical score = 2). Treated day 6 p.i. animals were scanned immediately following initial treatment on the morning of day 6 p.i., while treated day 7 p.i. animals were imaged 12+ h after receiving second treatment. Kruskal–Wallis analysis: olfactory bulbs, P = 0.0012; cortex, P = 0.0012; corpus callosum, P = 0.0031; and striatum, P = 0.0008. Error bars represent mean ± SD. Dunn’s post hoc analysis: *P < 0.05, **P < 0.005.

