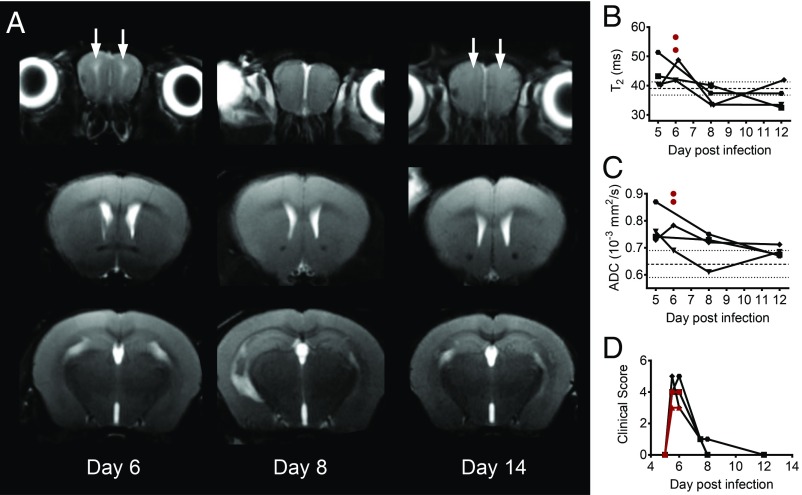
Fig. 5.
Longitudinal, coronal, T2-weighted images of JHU-083–treated animals. (A) Coronal T2-weighted images in a representative animal that survived long-term imaged after treatment at 6:00 AM on day 6 p.i. with JHU-083. Abnormal high signal intensity foci in the OBs appear on day 6 p.i. (solid white arrows) and then resolve by day 12 p.i. (B) Quantification of T2 values and (C) ADC values in the OBs of infected animals that responded to treatment (n = 4, black symbols) and two that progressed rapidly and did not survive despite treatment (n = 2, red circles) are shown. T2: paired t test comparison between day 5 and 8 p.i., P = 0.043; and ADC: paired t test comparison between day 5 and 8 p.i., P > 0.05. Dashed lines denote mean ± SD for T2 and ADC values in uninfected animals (T2, 39.1 ± 2.2 and ADC 0.64 ± 0.05). (D) Corresponding clinical score data vs. day postinfection for the imaged animals.

