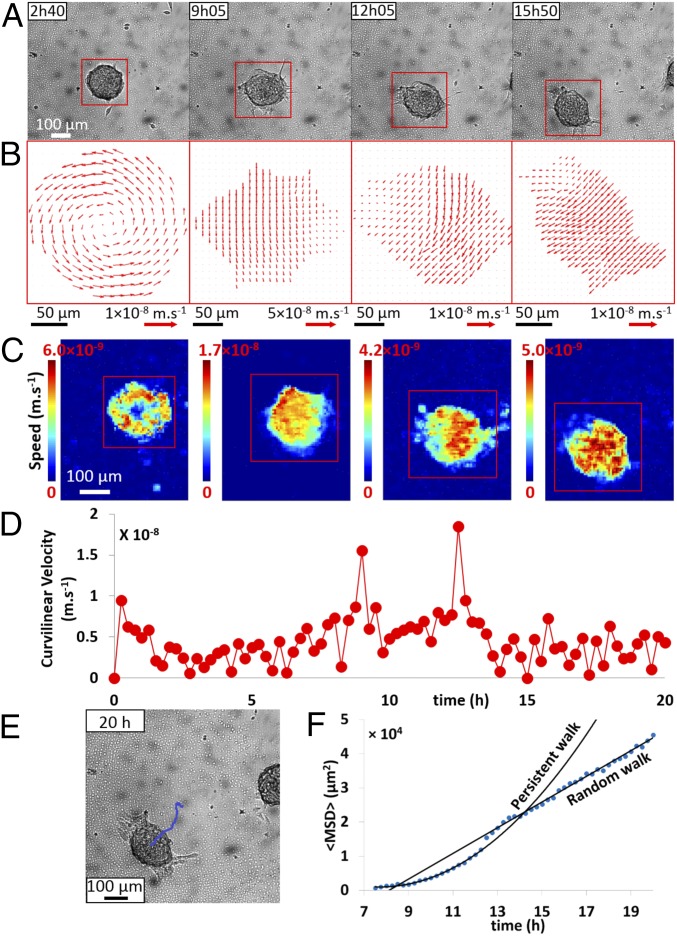
Fig. 3.
Motility of an aggregate on a PAA gel (E = 10.6 kPa). (A) Observed in bright field at different times. (B) Velocity vector fields (PIV) of aggregate migration from A. (C) Heat map of local aggregate speed corresponding to the velocity field (B). (D) Curvilinear velocity of the aggregate center of mass plotted versus time (Δt = 15 min). (E) Trajectory of an aggregate and (F) MSD over time: blue dotted line shows the experimental MSD and black lines indicate either a persistent walk () or a random walk ().

