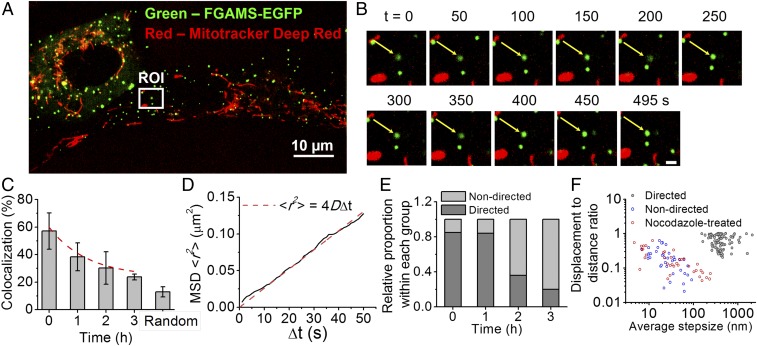
Fig. 5.
Effect of nocodazole treatment on purinosomes localization and motion in HPRT-deficient fibroblasts. (A) Representative two-color image showing the relative position of purinosomes (FGAMS-EGFP, green) to mitochondria (MitoTracker Deep Red, red) 2 h postnocodazole treatment. (B) Time-lapse images of the magnified ROI from A showing a purinosome (white arrow) that did not become colocalized with mitochondria during the study. (Scale bar, 1 µm.) (C) Purinosome–mitochondria colocalization percentage as a function of time postnocodazole treatment. Data are presented as mean ± SD, n = 30 cells from four independent experiments. (D) Time-average MSD plot of the trajectory in B (solid black line) fitted with the equation for normal diffusion (dashed red line). The diffusion coefficient of this purinosome was estimated as 6.55 × 10⁻⁴ µm2/s from data fitting. (E) Relative proportion of trajectories that displayed directed or nondirected motions as a function of time postnocodazole treatment. Only the trajectories of purinosomes not colocalized with mitochondria (−mito) were analyzed. n = 50 representative trajectories for each point. (F) A scatterplot of the displacement-to-distance ratio (DDR) vs. average step-size for each trajectory at t = 0 (control) and t = 2 h postnocodazole treatment (red). n = 183 total representative trajectories. The control trajectories were further partitioned into two categories: directed (black) and nondirected (blue).

