Fig. 1.
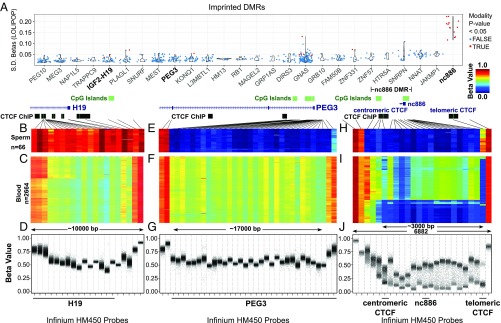
The nc886 DMR displays maternal polymorphic imprinting. (A) Populational variance for β-values in known imprinting control regions in peripheral blood. Each dot corresponds to one CpG interrogated by an HM450 probe. Populational SDs (y-axis) are plotted for CpGs located in known imprinting DMRs and nc886 (x-axis). Although all imprinting DMRs were examined, only imprinting control regions with more than five probes are included in the display and sorted by the mean SD in the population. Imprinting control regions were retrieved from an earlier study (38). Probes with multimodal distribution of β-values in the population are colored red. DNA methylation data were retrieved from the LOLIPOP study (39). (B, E, and H) DNA methylation data from the Infinium HM450 BeadChip platform in 66 sperm samples (GEO accession numbers GSE47627 and GSE64096) for a paternally methylated DMR for the H19 gene (B), a maternally methylated DMR for the PEG3 gene (E), and the nc886 DMR (H). Black lines point to the genomic location of each probe relative to the respective DMR. (C, F, and I) Heat map of HM450 β-values from peripheral blood for H19 (C), PEG3 (F), and nc886 (I); data obtained from Wahl et al. (39). (D, G, and J) β-Values of each sample are plotted for Infinium HM450 probes for H19 (D) PEG3 (G), and nc886 (J). HM450 probe IDs are provided in SI Appendix, Table S1. Only probes with sequence mapped optimally are included.

