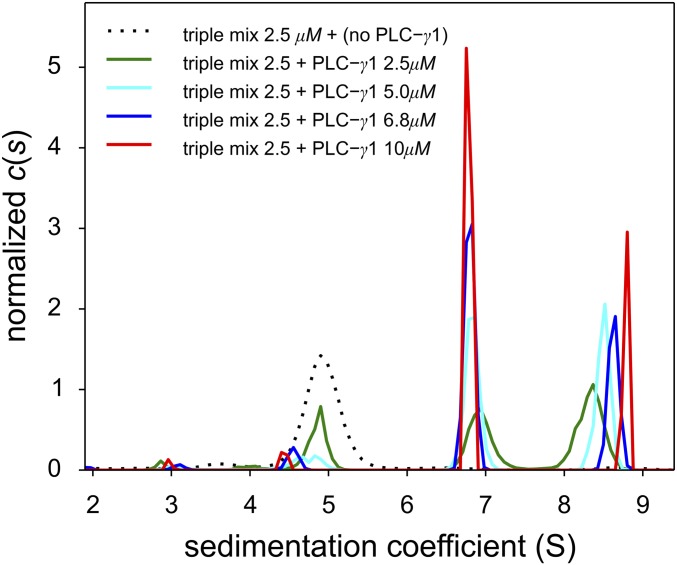
Fig. 3.
Titration series of a ternary mixture of equimolar pLAT488, Halo-GadsFL-646, and SLP-76tr-405 with various concentrations of PLC-γ1FL reveals increasing saturation of the quaternary complex. Shown are the c(s) distributions from interference optical SV-AUC data with pLAT488, Halo-GadsFL-646, and SLP-76tr-405, each at 2.5 μM, without PLC-γ1FL (dotted black line), and with PLC-γ1FL at 2.5 μM (green line), 5 μM (cyan line), 6.8 μM (blue line), and 10 μM (red line).

