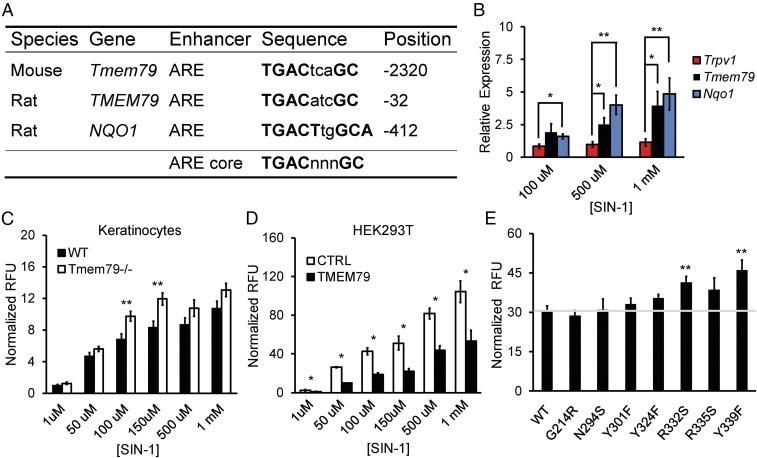
Fig. 2.
TMEM79 diminishes oxidative stress. (A) Table of antioxidant response elements (AREs) in rodent genes (Tmem79, TMEM79, and NQO1). Sequence identity and the position relative to the start codon for each gene are provided. The ARE core is shown for reference. (B) Real-time qPCR data for gene expression relative to Rpl19 in cultured P0 rat sensory neurons following 16-h incubation with concentrations of SIN-1. Data are shown as the mean relative expression ± SEM; n = 3 independent experiments with samples run in triplicate. **P < 0.01, *P < 0.05, two-tailed Holm t test. (C) Quantification of DCF fluorescence in acute cultures of keratinocytes from age-matched wild-type or Tmem79−/− mice following 30-min incubation with SIN-1 concentrations as noted. Data represent mean relative fluorescent units (RFU) normalized to baseline ± SEM; n = 7 mice with samples run in triplicate. **P < 0.01, two-tailed Student’s t test. (D) Quantification of DCF fluorescence in cultures of HEK293T cells expressing either control (CTRL) or mouse Tmem79 (TMEM79) vector following 30-min incubation with various SIN-1 concentrations. Data represent mean RFU normalized to baseline ± SEM; n = 3 or 4 experiments with samples run in triplicate. *P < 0.05, one-tailed Student’s t test. (E) Quantification of DCF fluorescence in cultures of HEK293T cells expressing vectors containing mouse Tmem79 (WT) or amino acid substitution mutants (G214R, N294S, Y301F, Y324F, R332S, R335S, and Y339F) following 30-min incubation in 150 µm of SIN-1. Data represent mean RFU normalized to baseline ± SEM. The horizontal gray line represents normalized RFU from mouse Tmem79 (WT) for reference. n = 5 experiments with samples run in triplicate. **P < 0.01, two-tailed Holm t test.

