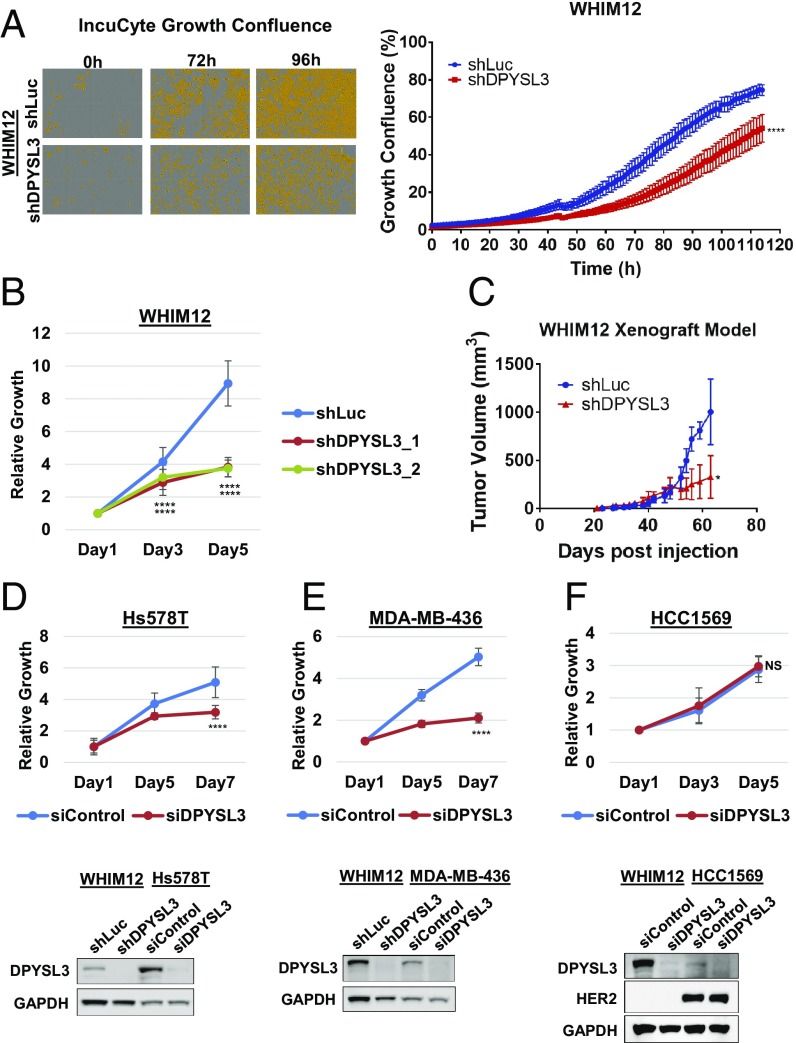
Fig. 2.
DPYSL3 drives growth in CLOW breast cancer experimental models. (A, Left) Representative images of vessel wells acquired on IncuCyte of stable WHIM12 shLuc and shDPYSL3 cells at indicated time points. Cells are pseudocolored orange to aid visualization. (A, Right) Quantification of A, Left, depicting vessel well confluency over the course of the experiment. Error bars indicate SEM. ***P < 0.001 (Student t test comparing confluency at the last time point measured). (B) Growth of stable WHIM12 shLuc, shDPYSL3_1, and shDPYSL3_2 cell lines. Data are averages from three independent experiments ± SEM. ****P < 0.001 (ANOVA, Tukey’s multiple comparisons test). (C) Tumor growth of WHIM12 xenografts. Data are shown as averages of four mice per group ± SEM. *P < 0.05 (Student t test comparing tumor volume at the last time point measured). (D–F) Growth of indicated cell lines transfected with siControl or siDPYSL3. Data are averages from three independent experiments ±SEM (D–F, Upper). ****P < 0.001 (Student t test comparing last time point measured). D–F, Lower show Western blots to compare DPYSL3 expression levels. GAPDH was used as a loading control.

