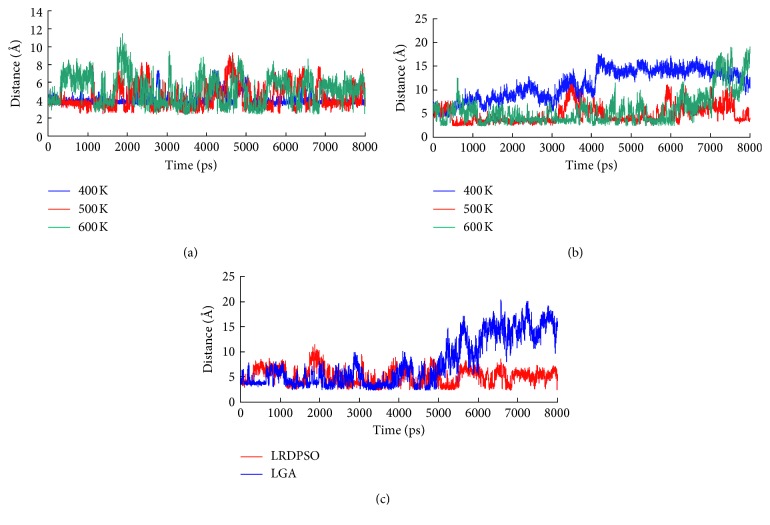
Figure 5.
Plot of salt bridge changes in the binding domain as a function of time. (a) Salt bridge ASP419-LYS1 changes in the LRDPSO-docked complex during the simulation from 400 K to 600 K; (b) salt bridge GLU229-LYS3 changes in the LRDPSO-docked complex during the simulation from 400 K to 600 K; (c) comparison plot of salt bridge ASP419-LYS1 in both complexes during the 600 K simulation.

