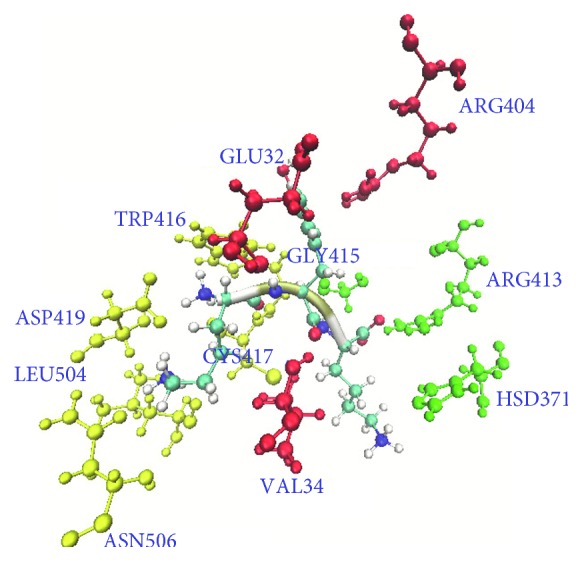
Figure 6.

Critical residues of the hydrogen bonds in the binding domain of the LRDPSO-docked result. Residues are shown as ball and stick models, and the ligand is shown in new cartoon secondary structure style. The residues are shown in different colors: yellow for the hydrogen bond network of LYS1 of the ligand, red for the hydrogen bond network of TYR2 of the ligand, and green for the hydrogen bond network of LYS3 of the ligand.
