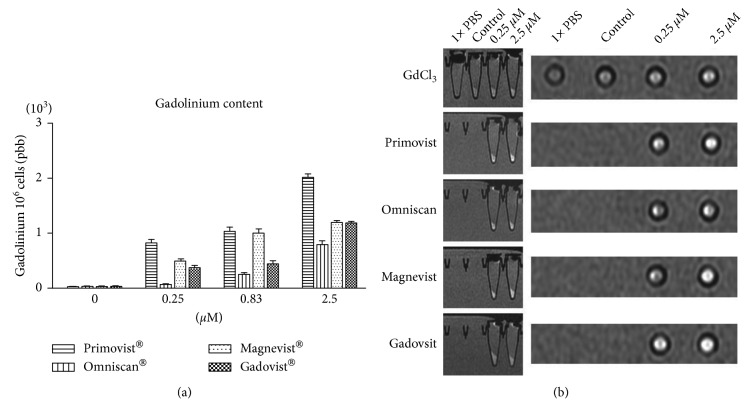
Figure 2.
MRI and gadolinium content of macrophages treated with various gadolinium chloride and GBCAs. ICP-MS analysis showed that the RAW cells generally contained gadolinium after treatment with the various Gd chloride and GBCAs (a) (n = 3). Coronal view and T1-weighted scanning protocols were performed (b). The cells were centrifuged to the bottom of the test tube and imaged as dark signals. The signal intensities of the cells revealed a dose-dependent increase on treatment with higher concentrations of Gd chloride and GBCAs for 24 h.

