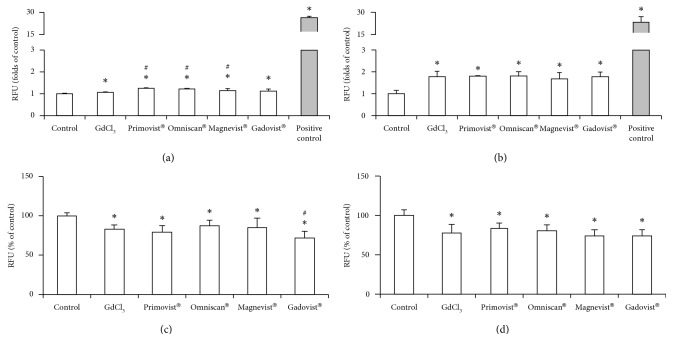
Figure 3.
The effects of the different GBCAs and gadolinium chloride-induced reactive oxidative species and mitochondrial membrane potential in cultured RAW 264.7. The production of ROS was measured after treatment with 2.5 μM Gd chloride or GBCAs for 4 h (a) and 24 h (b). Similarly, mitochondrial membrane potential was measured after 4 h (c) and 24 h (d) of treatment. ∗p < 0.05 when compared with the control, #p < 0.05 when compared with Gd chloride. Positive control, H2O2 (2000 μM) for 30 min.

